FIGURE 5.
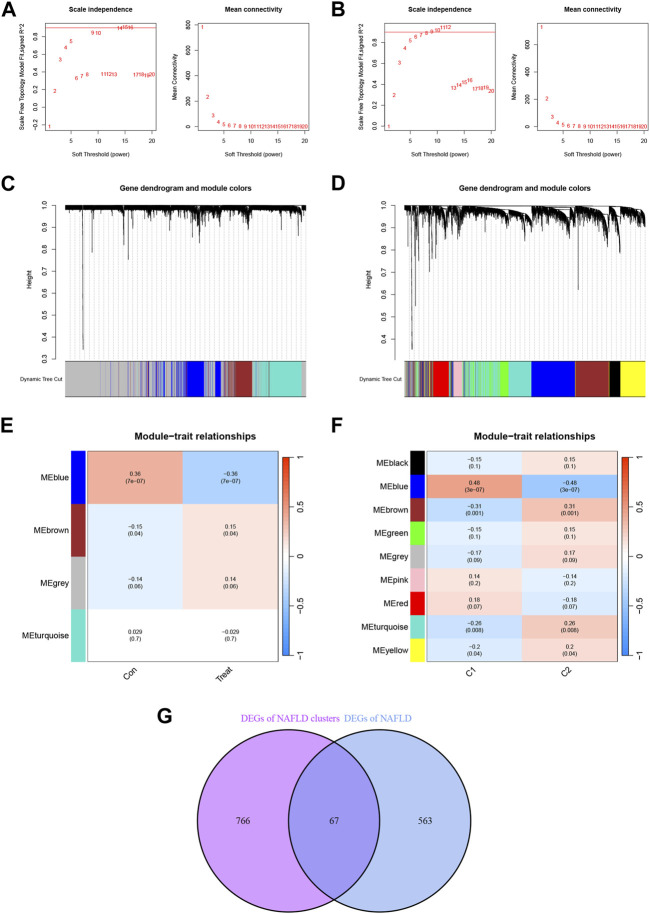
Identification of NAFLD disulfidptosis cluster-specific DEGs. (A) Determination of Soft Threshold power for the training set. (B) Determination of Soft Threshold power for the disulfidptosis cluster. When scale-free distribution is reached, the optimal soft-power value for training set is 14 while for the disulfidptosis clusters it was 6. (C) The origin and merge modules shown under the clustering tree for the training set. (D) Origin and merge modules shown under the clustering tree for the disulfidptosis clusters. The clustering dendrogram shows the clustering process of the gene modules. (E) Heatmap of the correlation between module eigengenes and the occurrence of NAFLD. (F) Heatmap of the correlation between module eigengenes and the disulfidptosis clusters. The values in the small cells of the graph represent the two-calculated correlation values cor coefficients between the eigenvalues of each trait and each module as well as the corresponding statistically significant p-values. (G) Crossover between module-associated genes in the disulfidptosis cluster and module-associated genes in the training set.

