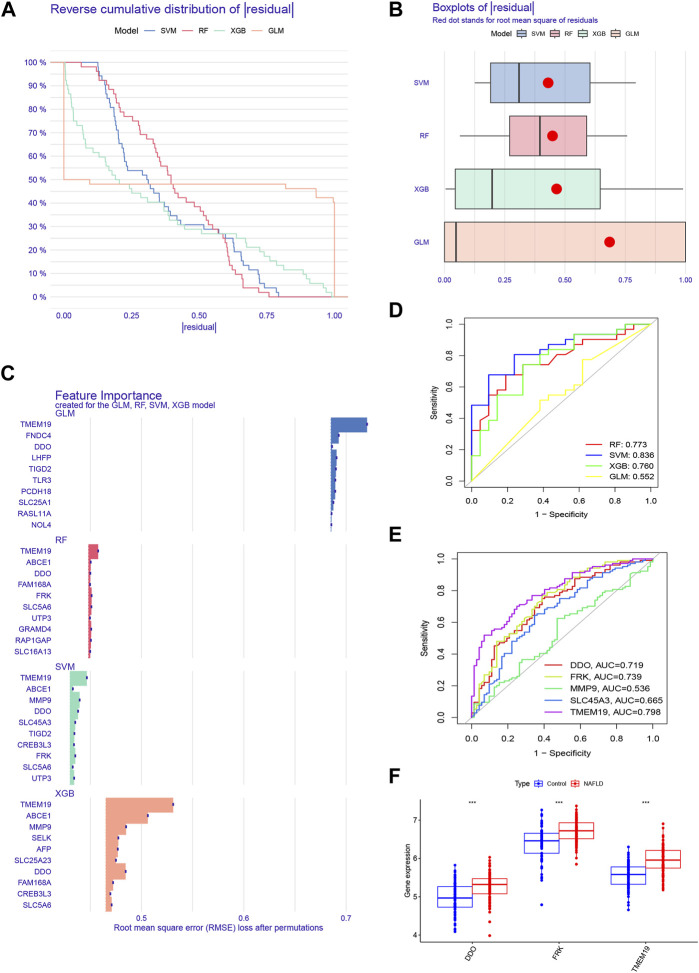
FIGURE 6.
Construction and evaluation of four machine models. (A) Cumulative residual distribution of each machine learning model. (B) Boxplots showed the residuals of four machine learning models. Red dot represented the root mean square of residuals (RMSE). (C) The important features in four machine models. (D) ROC analysis of each machine learning model based on 5-fold cross-validation in the testing cohort. (E) ROC analysis of DDO, FRK, MMP9, SLC45A3, and TMEM19 in the training set. (F) Boxplots showed the expression of DDO, FRK and TMEM19 between NAFLD and control groups in the training set.

