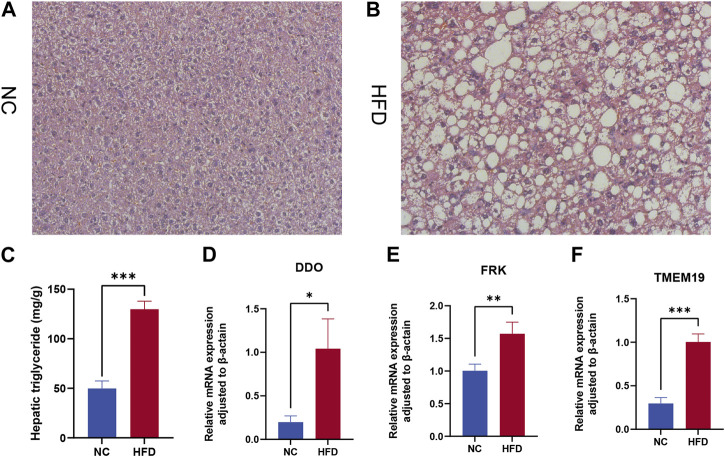
FIGURE 9.
Expression levels of model gene mRNA were verified in the HFD mouse model. β-Actin was controlled. (A,B) H&E staining of livers from control (A) and high-fat diet (HFD) fed mice (B). Magnification ×400. (C) Hepatic triglyceride (TG) concentrations. (D–F) Relative mRNA levels of (D) DDO, (E) FRK, and (F) TMEM19. Relative mRNA levels were normalized to those of β-actin. Values are shown as the mean ± s.d. *p < 0.05; **p < 0.01, ***p < 0.001.

