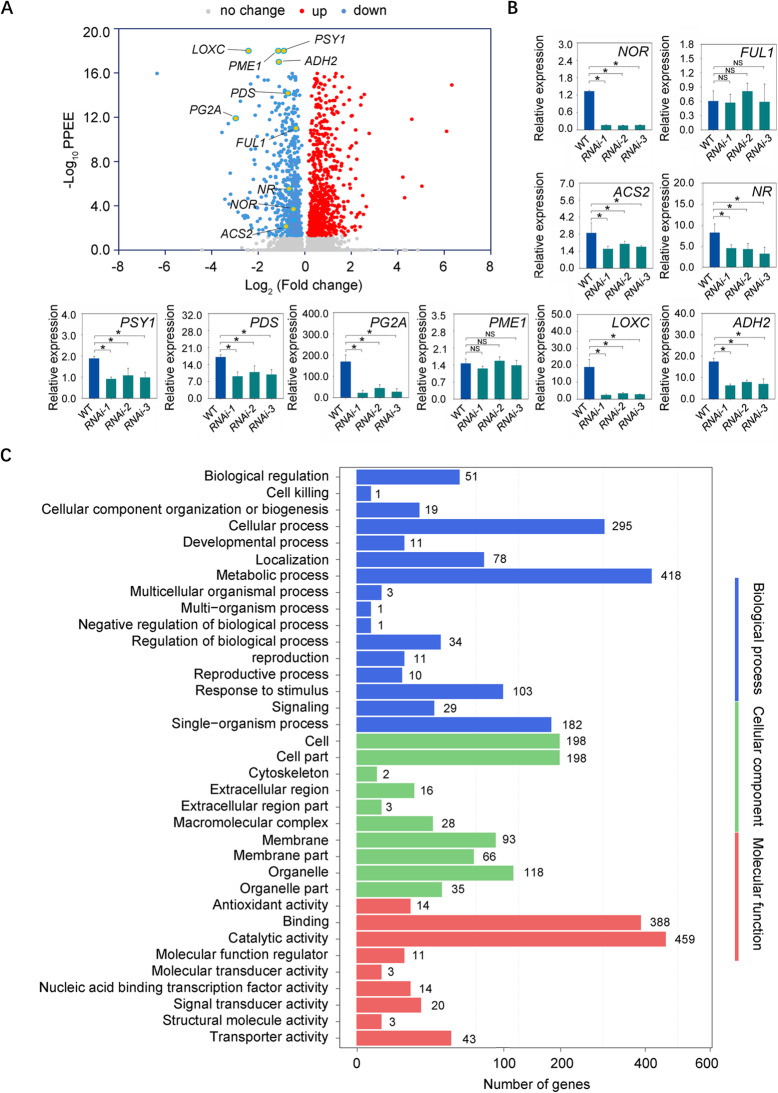
Fig. 3.
SlDof1 affects the expression of hundreds of genes as revealed by RNA sequencing. (A) Volcano plot visualization of RNA sequencing data. Red points represent upregulated genes, and blue points represent downregulated genes, in SlDof1 RNAi fruit compared with that of the wild type at 38 days post-anthesis. Ten ripening-related genes are indicated by orange points. (B) Quantitative RT-PCR validation of the relative expression levels of the 10 ripening-related genes in the fruit of the wild-type (WT) and SlDof1 RNAi lines. Values are means ± SD of three biological replicates. Asterisks indicate significant differences (P < 0.05; Student’s t-test). NS, not significant. NOR, nonripening; FUL1, fruitfull 1; ACS2, ACC synthase 2; NR, never-ripe; PSY1, phytoene synthase 1; PDS, phytoene desaturase; PG2A, polygalacturonase A; PME1, pectinesterase 1; LOXC, lipoxygenase C; ADH2, alcohol dehydrogenase 2. (C) Gene Ontology (GO) analysis of genes that were differentially expressed in the SlDof1 RNAi fruit compared with that of the wild type. The number of genes belonging to each GO category is shown

