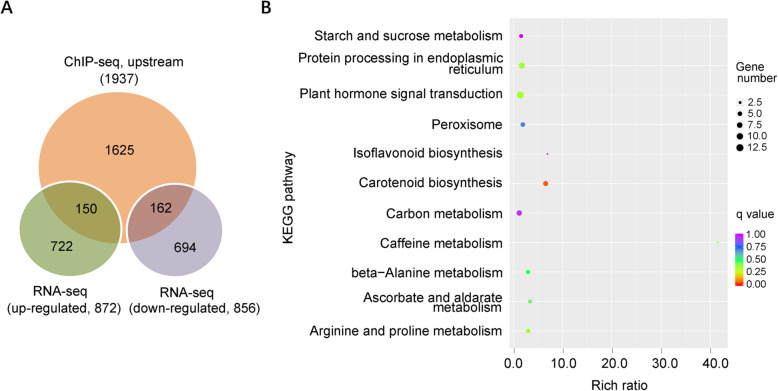
Fig. 5.
Genome-wide identification of SlDof1 direct target genes. (A) Venn diagram showing the overlap between genes bound by SlDof1 from chromatin immunoprecipitation sequencing (ChIP-seq) and genes differentially expressed in SlDof1 RNAi fruit determined by RNA sequencing (RNA-seq). (B) Kyoto Encyclopedia of Genes and Genomes (KEGG) analysis of SlDof1 target genes. The size of the circle represents the number of genes belonging to that KEGG pathway, and the color represents the q value of pathway enrichment determined by Fisher’s exact test with Bonferroni correction

