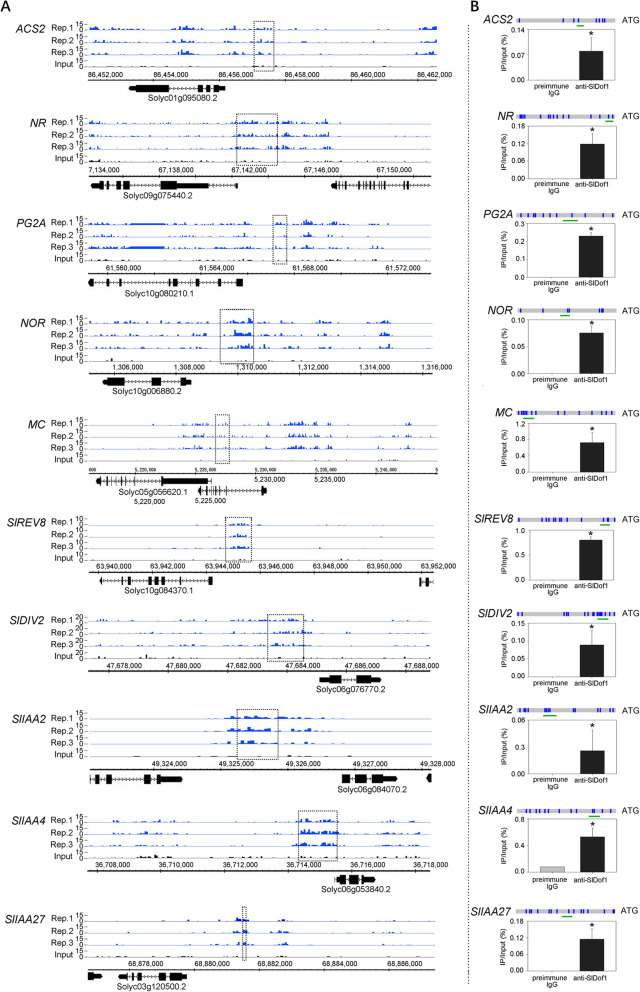
Fig. 6.
Validation of SlDof1 direct target genes by ChIP-qPCR. (A) The raw chromatin immunoprecipitation sequencing peaks from three biological replicates for indicated genes are shown. Black dot-line rectangles mark the peak regions that were detected within 2 kb upstream of the transcription start site in all three biological replicates. The structure of the corresponding gene is presented below with black bars representing exons and lines representing introns. The direction of transcription is indicated by arrows. (B) ChIP-qPCR analysis reveals that SlDof1 binds to the promoter regions of selected genes. The promoter structures of the target genes are shown. Blue boxes represent SlDof1 binding motifs. Green lines indicate the region used for ChIP-qPCR. All primers were designed based on the peak sequences enriched in ChIP sequencing. Values are the percentage of DNA fragments that co-immunoprecipitated with anti-SlDof1 antibodies or non-specific antibodies (preimmune IgG) relative to the input DNAs. Error bars represent the SD of three independent experiments. Asterisks indicate significant differences (P < 0.05; Student’s t-test). ACS2, ACC synthase 2; NR, never-ripe; PG2A, polygalacturonase A; NOR, nonripening; MC, macrocalyx; SlREV8, a homolog of Arabidopsis REVEILLE8; SlDIV2, a homolog of Arabidopsis DIVARICATA; SlIAA2, Aux/IAA 2; SlIAA4, Aux/IAA 4; SlIAA27, Aux/IAA 27

