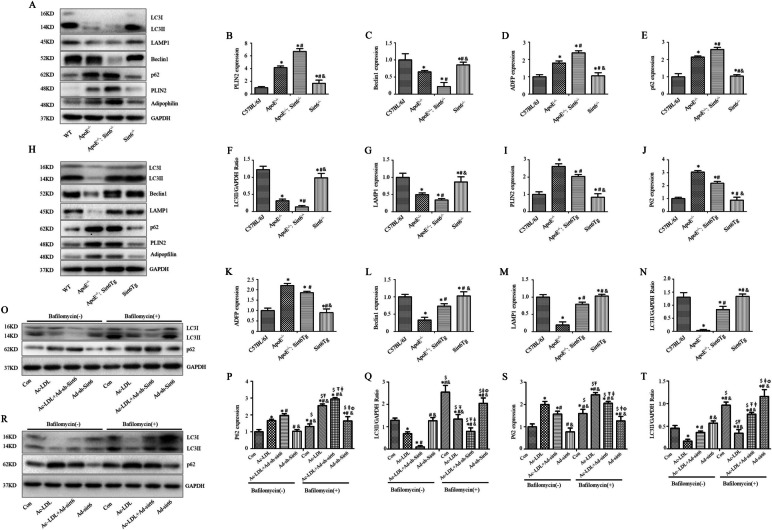
Fig. 4.
Sirt6 regulates foam cell lipolysis through increased lipophagic flux. A–N Immunoblots and quantitative analyses of the expression of LC3b, LAMPI, Beclin1, p62, PLIN2 and adipophilin; data are expressed as mean ± SEM (One way ANOVA showed that there was statistical significance among groups. *P < 0.05 versus the C57BL/6J group; #P < 0.05 vs the ApoE−/− group; &P < 0.05 vs the ApoE−/−:Sirt6−/− group [n = 10]). O–Q Results from immunoblotting and quantitative studies of LC3 and p62 in cultured macrophages without or with bafilomycin A1; data are expressed as mean ± SEM (One way ANOVA showed that there was statistical significance among groups. *P < 0.05 vs the control group; #P < 0.05 vs the Ac-LDL group; &P < 0.05 vs the Ac-LDL + Ad-sh-Sirt6 group; $P < 0.05 vs the Ad-sh-Sirt6 group; ŦP < 0.05 vs the control + bafilomycin A1 group; ǂP < 0.05 vs the Ac-LDL + Ad-sh-Sirt6 + bafilomycin A1 group; ФP < 0.05 vs the Ac-LDL + Ad-Sirt6 + bafilomycin A1 group). R–T LC3 and p62 levels in cultured macrophages without and with bafilomycin A1 were analyzed by immunoblotting and quantitative analysis (One way ANOVA showed that there was statistical significance among groups. *P < 0.05 vs the control group; #P < 0.05 vs the Ac-LDL group; &P < 0.05 vs the Ac-LDL + Ad-Sirt6 group; $P < 0.05 vs the Ad-Sirt6 group; ŦP < 0.05 vs the control + bafilomycin A1 group; ǂP < 0.05 vs the Ac-LDL + Ad-Sirt6 + bafilomycin A1 group; ФP < 0.05 vs the Ac-LDL + Ad-Sirt6 + bafilomycin A1 group [n = 6 separate experiments])

