Fig. 1.
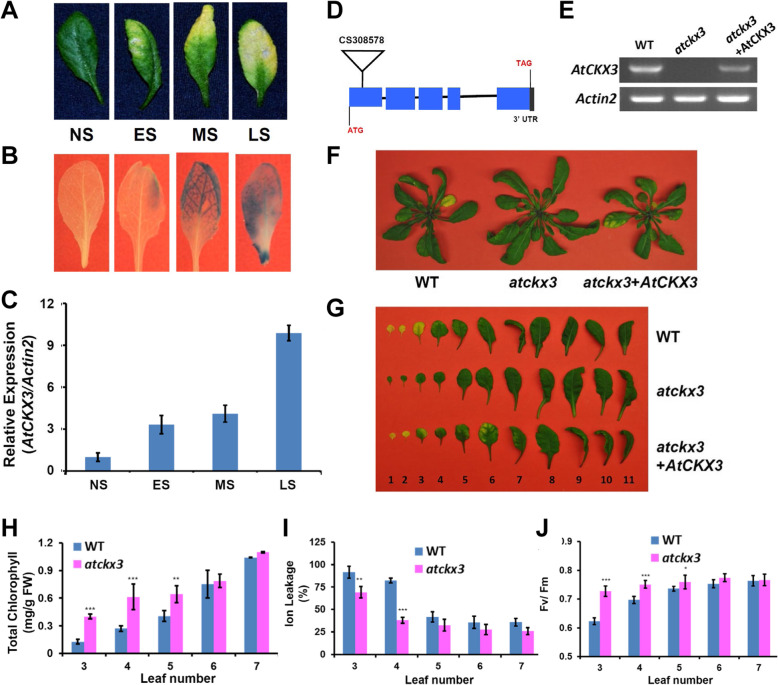
Phenotypical, physiological and molecular genetic analyses of AtCKX3 (a.k.a. SAG202). (A) Leaves at different stages of senescence. NS, non-senescence; ES, early senescence with < 25% leaf yellowing; MS, mid-senescence with ~ 50% leaf yellowing; LS, late senescence with > 75% leaf yellowing. (B) GUS staining of the PAtCKX3-GUS transgenic leaves at different senesce stages shown in (A). (C) qPCR analysis of the AtCKX3 expression during senescence in wild type (WT) leaves. Data indicate average values ± SD of three samples. (D) Gene structure of AtCKX3 and T-DNA insertion site in the first exon region of gene in Arabidopsis line CS414980 (designated as atckx3). (E) RT-PCR analyses of AtCKX3 transcripts in senescent leaves of WT, atckx3 (CS414980) and a complementation line (atckx3 + AtCKX3). (F) Age-matched rosette leaves of WT, atckx3 and the complementation line (atckx3 + AtCKX3). (G) Leaves detached from the age-matched plants in (F). Leaves were counted from bottom with the oldest leaf as 1 and the youngest leaf 11. Pictures were taken at 35 DAG (days after germination). Measurements of chlorophyll contents (H), ion leakage (I), and Fv/Fm ratios in age-matched leaves (no. 3 through no. 7) of WT and atckx3 plants (35 DAG). FW, fresh weight. Error bars represent SD of six repeats. *, ** and *** represent significant differences of P < 0.05, P < 0.01 and P < 0.001, respectively. Student’s t-test was used

