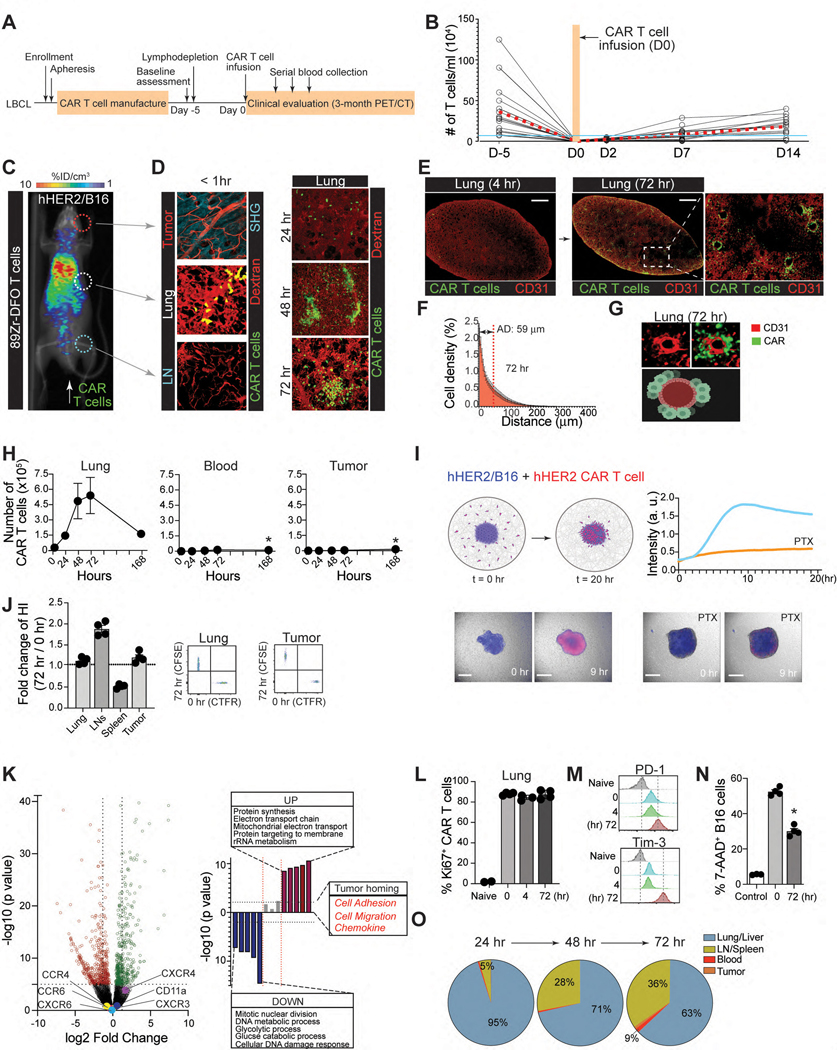
Figure 1. CAR-T cells are immediately accumulate in the lung after adoptive transfer.

A. Clinical protocol for CAR T-cell infusion (CTL019). B. Blood T cell counts from patients (n = 15). Red dashed line, the mean ; blue line, total blood lymphocyte counts. C & D. Visualization of early sequestration (0–1 hr) of hHER2 CAR-T cells after adoptive transfer with PET/CT (89Zr-DFO-labeled T cells) (C) or IV-MPM (red, dextran-labeled vessels; green, GFP-expressing CAR-T cells; blue, SHG) (D). IV-MPM images from the lung at the indicated times post-injection (D). Scale bars, 50 μm. E. Representative 3D imaging of CAR-T cell accumulation in cleared lung 4 and 72 hr after i.v. injection (red, blood vessels; green, CAR-T cells). Scale bars, 1 mm. F. The cell density curve and histogram of the distribution of T cells extravasated from the nearest blood vessel (attraction distance, AD). G. 3D image of GFP-expressing CAR-T cells and CD31-labeled vessels. H. The number of injected CAR-T cells in the lung, blood, and tumor at the indicated times. I. in vitro migration of hHER2-CAR T cell (red) to hHER2-B16-BFP tumor spheroid (blue) and . Scale bars, 100 μm. J. CAR-T cells from the lung 72 hr after i.v. injection (T72; CFSE) and newly in vitro activated CAR-T cells (T0; CTFR) were co-transferred (1:1 mix) and the fold change in the homing index was analyzed 24 hr after injection (n = 4, 13 mice per experiment). K. Volcano plot and signaling pathway from RNA-seq analysis in CAR-T cells (T72 vs. T0). L. Percentage of Ki67+ cells in vitro activated CAR-T cells (0 hr) or CAR-T cells isolated from the lung after i.v. injection (4 and 72 hr). M. Flow cytometry results of PD-1 and Tim-3 expression levels on naïve and CAR-T cells isolated from the lung at indicated times post-injection. N. The cytotoxicity of CAR-T cells (PBS, T72, and T0) against B16-hHER2. O. The proportion of CAR-T cells distributed across different organs post-injection. Representative image of 5 mice (D-E). Representative data from three experiments with n = 3 per group (L-N) n = 3 mice per group (F, O). Results are shown mean ± SEM (H, J, L, N). The data were analyzed by ordinary one-way ANOVA with Tukey’s multiple comparison posttest (H) or two-tailed Student’s t test (N).
