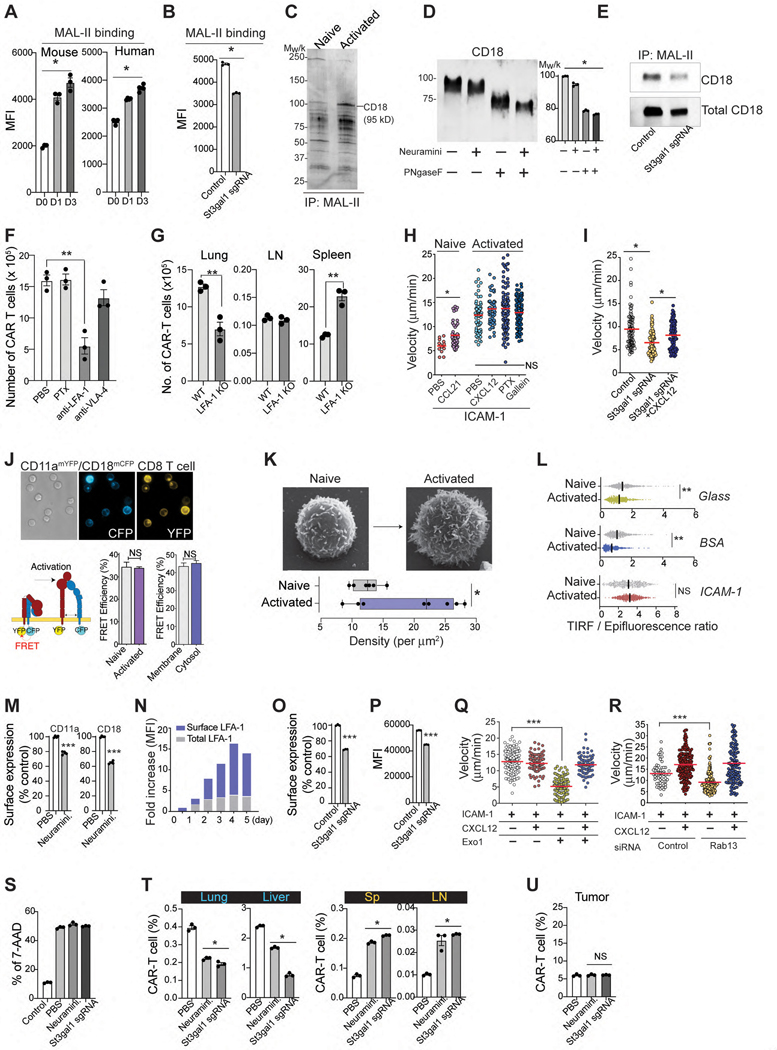
Figure 3. St3gal1 regulates LFA-1 mediated CAR-T cell migration.
A & B. MAL-II binding to CD8 T cells (A) and St3gal1 KO CAR-T cells (B). C. Immunoprecipitation of MAL-II-binding proteins in CD8 T cells. D. Western blot of the activated CD8 T cell lysates after enzyme treatments. In the graph, each bar represents the calculated molecular weight of protein bands. E. Immunoprecipitation of MAL-II binding CD18 in activated CD8 T cells. F. Recruitment of CAR-T cells into lung tissue (n = 3 mice per group). G. The numbers of WT or LFA-1 (CD11a)-KO CAR-T cells 24 hr after CAR-T cells injection (n = 3). H. In vitro CD8 T cell migration on ICAM-1-coated plates. (n = 3, 13–38 individual cells per mouse). I. In vitro activated CD8 T cell migration on ICAM-1-coated plates ± CXCL12. (n = 3, 10–57 individual cells per mouse). J. LFA-1 FRET assay with CD11a-mYFP and CD18-mCFP. Scale bars, 5 μm. (n = 3, 20–40 individual cells per condition). K. The density of microvilli of CD8 T cells by SEM (n = 6–8). Scale bars, 1 μm. L. The ratio of the TIRFM signal from the LFA-1 accumulation of CD8 T cells at sites of contact with the surface (n=3). M. Changes in the endocytosis of LFA-1 in CD8 T cells after treatment with α2,3-neuraminidase (n = 3–4). N. Time course of surface and intracellular LFA-1 expression. O & P. Changes in the endocytosis (O) and cell surface expression (P) of LFA-1 in CAR-T cells. (n = 3). Q & R. The migration of activated CD8 T cells pretreated with Exo1 (Q) or transfected with Rab13 siRNA (R) (n =3, 20–68 individual cells per mouse). S. The cytotoxicity of CAR-T cells against B16-hHER2 (n = 3). T & U. The percentage of hHER2 CAR-T cells in peripheral tissue sites (T) and tumors (U) 24 hours after adoptive transfer (n=3 mice per group). Results are shown mean fluorescence intensities (MFI) ± SEM (A-B) and mean ± SEM (C, F-M, O-P). All data and representative images reflect three independent experiments. Statistical analyses were performed using one-way ANOVA with Bonferroni posttest (A-C, H-I, Q-R), two-sided Mann-Whitney test (F, T-U), two-sided, unpaired Student’s t test (G, J) or two-tailed Student’s t test (K-M, O-P). NS; not significant.

