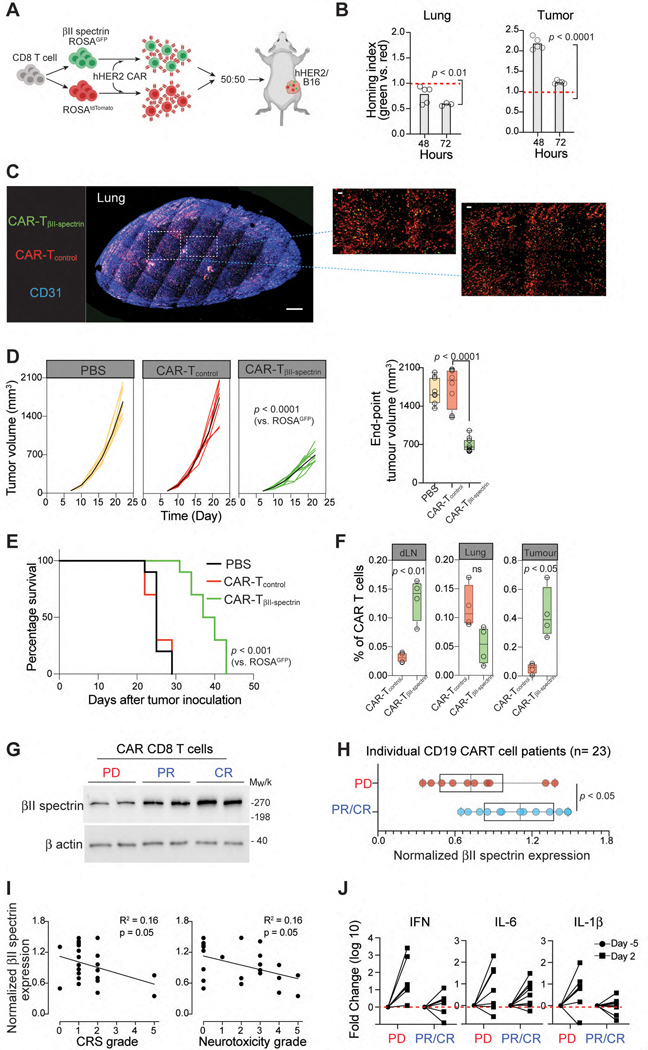
Figure 5. βII-spectrin expression predicts patient response to CAR-T cell therapy.
A. Schematic showing the assessment of tissue homing of TβII-spectrin (green) and Tcontrol (red) cells transfected with hHER2-CAR in hHER2 Tg mice bearing B16-hHER2 tumors. B. TβII-spectrin (green) and Tcontrol (red) hHER2-CAR were cotransferred (1:1 mix) and the fold change in the homing index was analyzed at each time point (n = 5 mice per condition). C. Represented deep 3D imaging (1-mm thick) of CAR-T cell accumulation in a cleared mouse lung 72 hr after i.v. injection (blue; blood vessels [CD31], green; TβII-spectrin, red; Tcontrol). Scale bars, 100 μm. D. Tumor growth and final tumor size from hHER2 Tg mice bearing B16-hHER2 tumors infused with TβII-spectrin and Tcontrol cells transfected with hHER2-CAR (n = 10 mice per group). E. Mouse survival curves up to 50 d after tumor inoculations. F. Frequency of CAR-T cells over total lymphocytes in B16-hHER2 tumours, lung, or dLN as measured by flow cytometry on day 22. respectively (n = 4). G. βII-spectrin western blot analysis of CAR-T cell infusion products obtained from 23 BCL patients who showed a complete recovery (CR), partial recovery (PR), or progressive disease (PD). Representative male and female samples from each patient group are shown. H. Quantification of total βII-spectrin protein expression in CAR-T cell products from patients with CR, PR, or PD as determined by western blotting. I. Correlation between βII-spectrin expression in CAR-T cell products and patient neurotoxic effects and cytokine release syndrome. Pearson correlation calculations were performed for linear correlations. J. Luminex assay of the proinflammatory cytokines IFN-γ, IL-6 and IL-1β in patient serum before (Day −5) and after (Day 2) CAR-T cell infusion. The data represent the mean ± SEM (B, D, F, H). Statistical analyses were performed by ordinary two-way ANOVA (D), two-sided, unpaired Student’s t test (B, D, H) or two-sided log-rank Mantel–Cox test (E). Whiskers represent maximum and minimum values (D, F, H).

