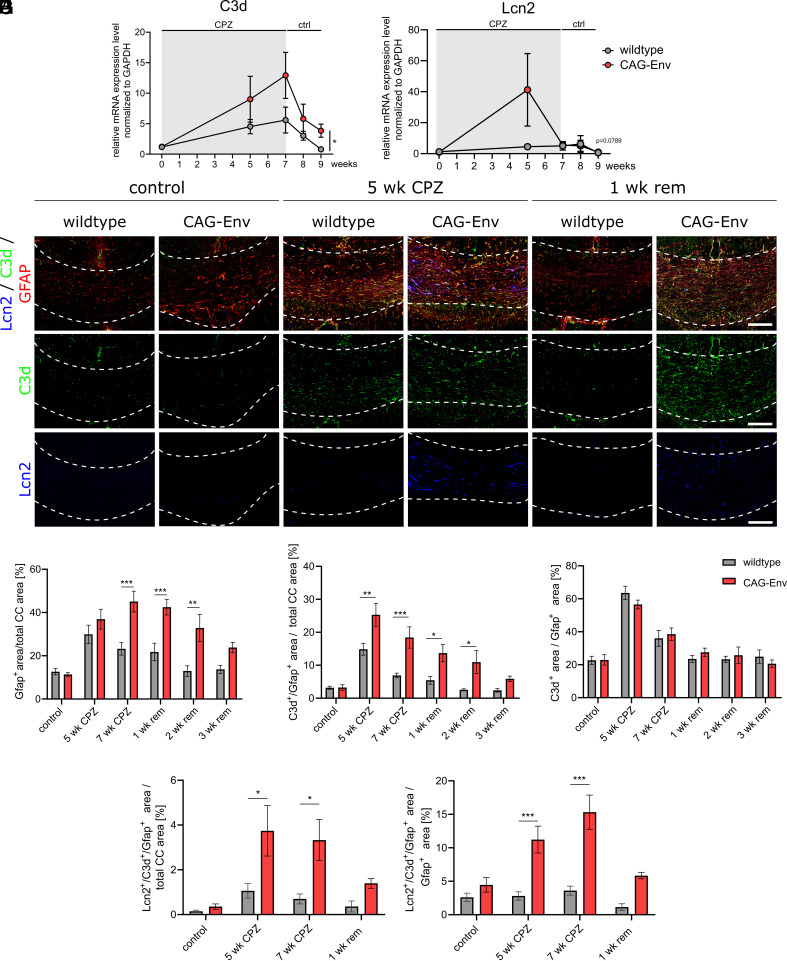
Fig. 4.
Transgenic expression of HERV-W ENV activates astrocytes. (A and B) C3d and Lcn2 expression gene expression analysis at various time points, before, during and after CPZ treatment in wt vs. transgenic CAG-Env mice. (C) Representative immunohistochemical images of C3d-, Lcn2- and Gfap- (co)expressing cells in wt and transgenic corpus callosum tissue sections (control and CPZ treated). (D) Quantification of Gfap-positive areas within the corpus callosum of wt and CAG-Env mice (control and CPZ treated). (E) Quantification of C3d/Gfap double-positive areas within the corpus callosum of wt and CAG-Env mice (control and CPZ treated). (F) Relative proportion of C3d/Gfap double-positive astrocytic areas in wt and CAG-Env animals (control- and CPZ treated). (G) Analysis of Lcn2/C3d/Gfap triple-positive astrocytic areas with the corpus callosum of wt and transgenic mice (control and CPZ treated). (H) Relative proportion of Lcn2/C3d/Gfap triple-positive astrocytic areas within the corpus callosum of transgenic and control mice upon CPZ treatment. Data are presented as mean values (n = 6) ± SEM. Significance of gene expression analysis was assessed by Student’s unpaired t test of calculated AUCs whereas the statistical significance of histological data was analyzed via 2-way ANOVA followed by Sidak’s post hoc test. Data were considered as statistically significant (95% CI) at *P < 0.05, **P < 0.01, ***P < 0.001. CC = corpus callosum. Dashed lines in C demarcate the area of the corpus callosum. (Scale bar in C: 100 µm.)

