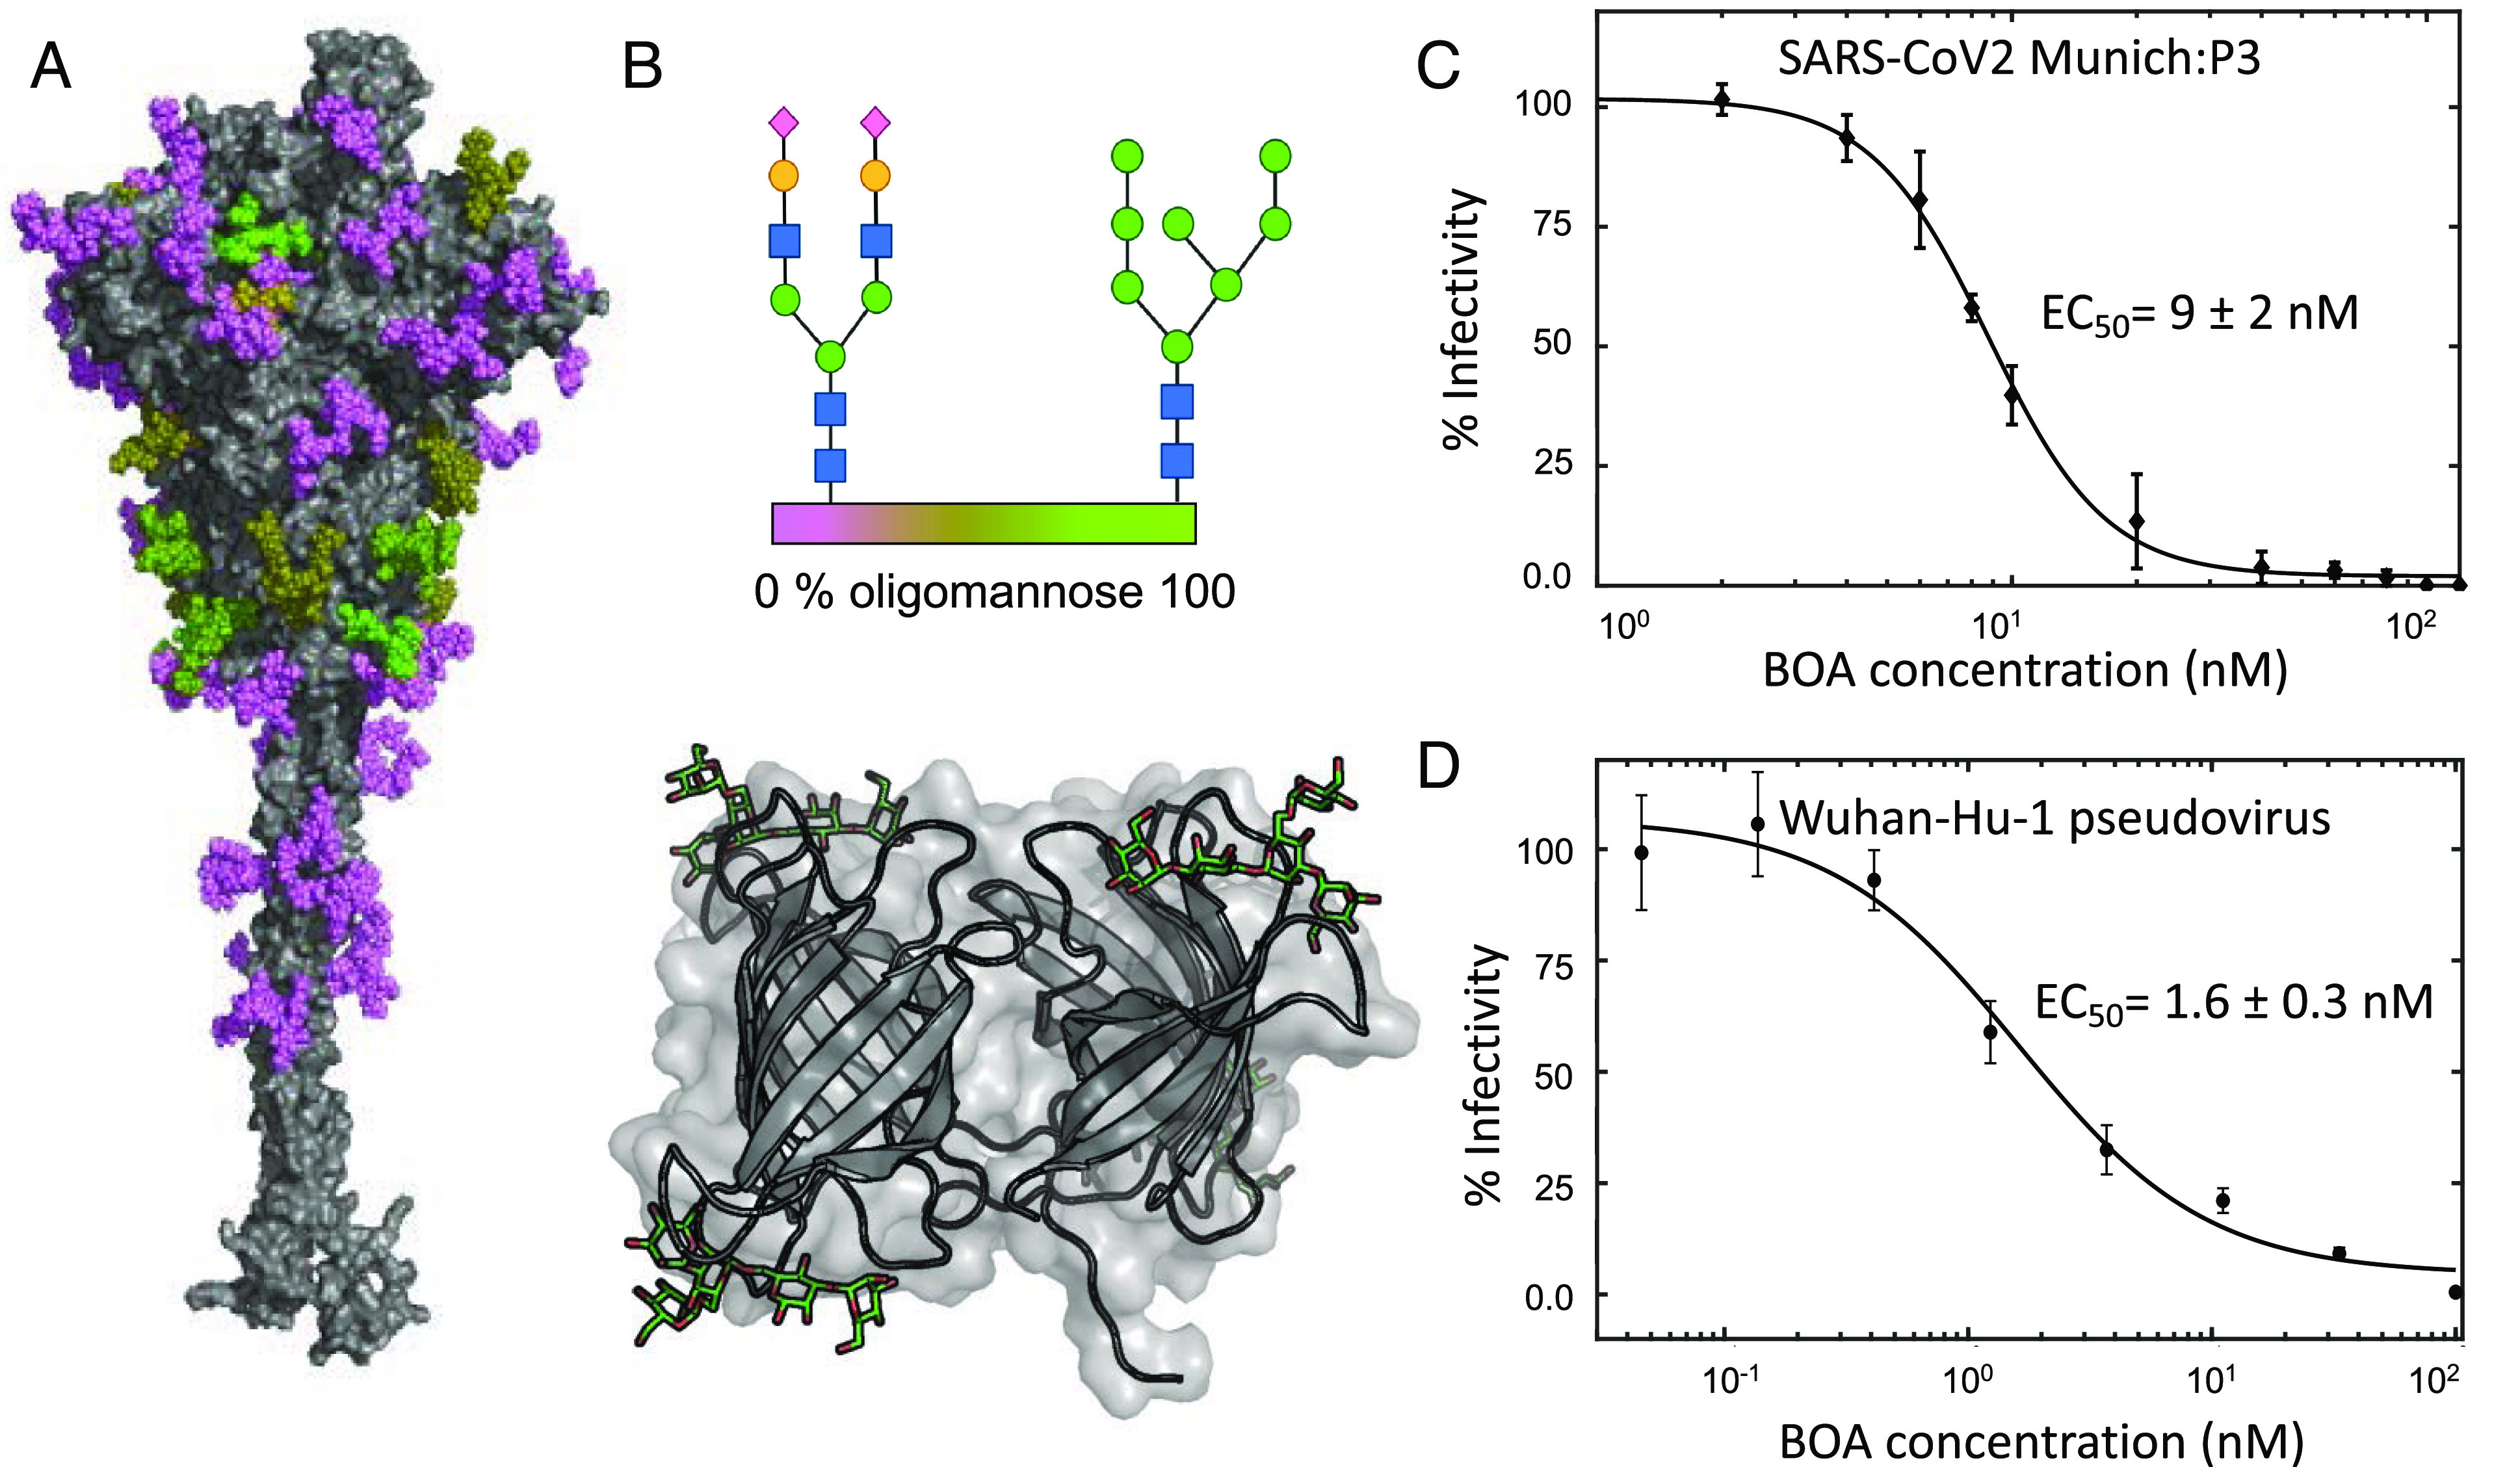
Fig. 1.

Inhibition of SARS-CoV-2 infection by BOA. (A) Surface representation of the SARS-CoV-2 spike protein (gray) with glycans colored according to glycotype (>90% oligomannose occupancy (lime), 50 to 75% oligomannose occupancy (olive), or complex (violet)). (B) Schematic representation of a complex glycan and high mannose glycan (Top) and the BOA-mannopentaose structure (Bottom). Each sugar is denoted by shape and color (green circles, mannose; blue squares, N-acteyl glucosamine; yellow circles, galactose; purple diamonds, N-acetyl-neuraminic acid). The structure of BOA is shown in ribbon representation and 3α,6α-mannopentaose in green stick representation (PDB ID: 4GK9). (C) Concentration-dependent inhibition of the SARS-CoV-2 Munich isolate by BOA, as measured by a plaque reduction assay and following normalization, yielding an EC50 value of 9 ± 2 nM. (D) Concentration-dependent inhibition of HIV-1 pseudotyped with Wuhan-Hu-1 spike protein by BOA, as measured by using a luciferase reporter, yielding an EC50 value of 1.6 ± 0.3 nM.
