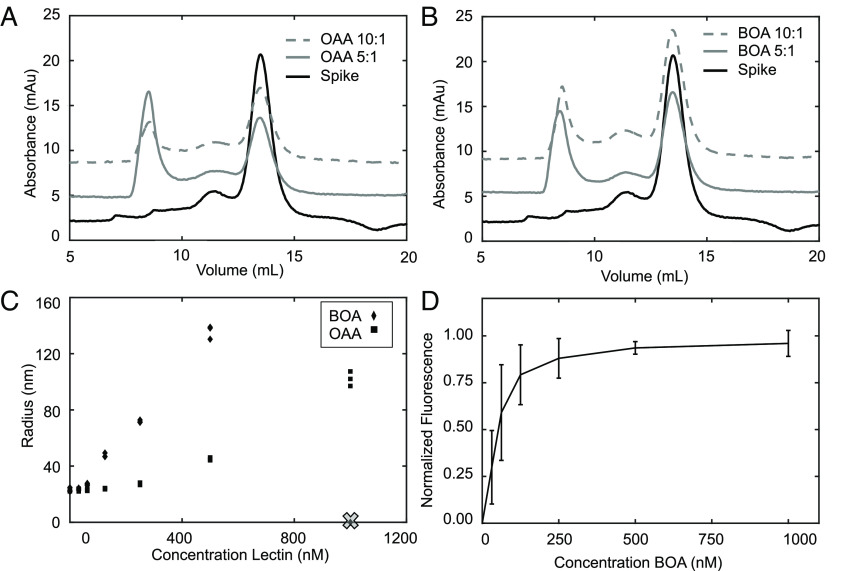
Fig. 2.
OAA and BOA interact with and aggregate spike protein in vitro at nM concentrations. (A and B) Size exclusion chromatography of spike protein without or with OAA (A) or BOA (B) at 5:1 (gray) and 10:1 (gray dotted) molar excess of lectin. (C) Hydrodynamic radius of particles monitored by DLS of spike protein in the presence of increasing concentrations of OAA or BOA (X represents the detection limit). (D) Binding isotherm of BOA binding to spike protein extracted from fluorescence measurements. Normalized fluorescence is plotted as a function of BOA concentrations.

