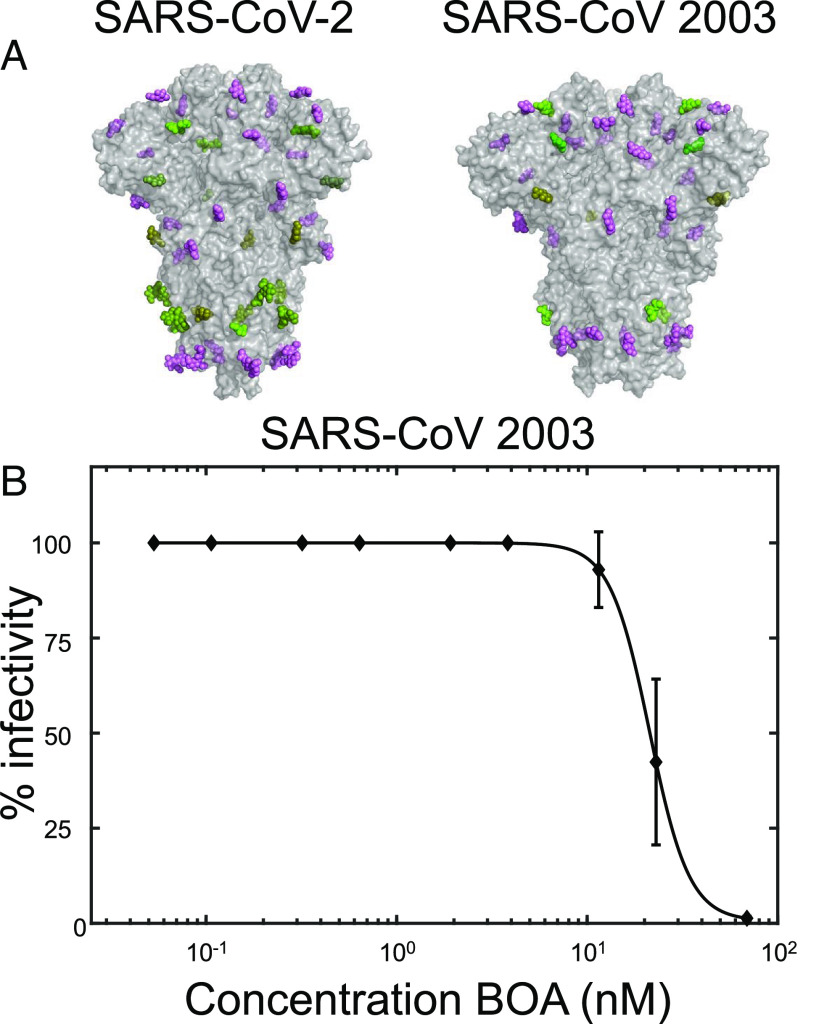
Fig. 5.
Comparison of SARS-CoV-2 and SARS-CoV 2003 spike proteins and BOA inhibition of SARS-CoV 2003. (A) Surface representation of the X-ray structures of SARS-CoV-2 (PDBID: 6VXX) and SARS-CoV 2003 (PDBID: 5X58) spike proteins. Amino acids are shown in gray and sugars are colored by glycotype: >90% oligomannose occupancy (lime), 50 to 75% oligomannose occupancy (olive), and complex (violet). (B) Inhibition assay of the SARS-CoV 2003 Urbani isolate modified with a luciferase reporter reveals an EC50 of 26 ± 0.3 nM.

