Figure 1.
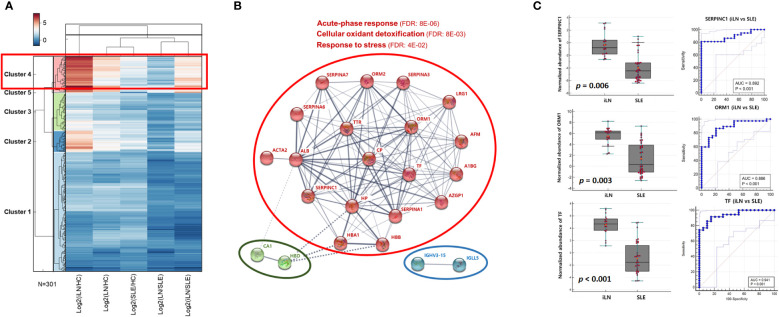
Comparative urinary proteome analysis (A) Hierarchical clustering analysis of the expression of proteins in the iLN group compared with the HC, SLE, and LN (B) Protein interaction map was generated using DEPs which increase more than 2 times with p < 0.05 in iLN group compared SLE group (Cluster 4) and gene ontology was performed using STRING embedded option. Red circle indicate that 19 protein-consisted network including SERPINA1 and ORM1 are belonged to 3 biological processes (acute-phase response, cellular oxidant detoxification and response to stress) (C) Box plots and ROC curves for SERPINC1 (upper panel) and ORM1 (lower panel) in the iLN group and SLE group; HC, healthy controls; LN, lupus nephritis groups; iLN, initial LN; SLE, systemic lupus erythematosus; DEPs, differentially expressed proteins; ROC; receiver operating characteristics.

