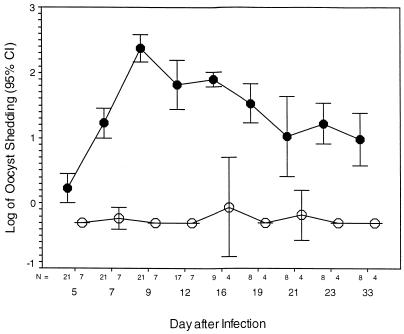
FIG. 1.
GKO mice (C57 background) (•) and control C57 mice (○) were each infected with 5,000 oocysts 28 days after observation was begun. At all times after infection, the log-transformed oocyst shedding score was significantly greater in GKO mice than in control C57 mice (P < 0.001 at all time points). The overall oocyst shedding score (log mean ± standard deviation) for the GKO group was 1.38 ± 0.08, while that for the C57 control group was −0.26 ± 0.02 (P < 0.001). CI, confidence interval.

