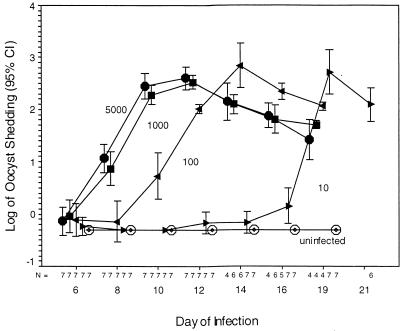
FIG. 2.
Groups of seven GKO mice were infected with 0 (○), 10 (▸), 100 (◂), 1,000 (■), or 5,000 (•) oocysts. The time to peak patency was related to the inoculum, and before mice began to die of the infection, oocyst excretion was temporally related to the initial inoculum. Each order-of-magnitude fall in the inoculum led to a 2- to 3-day delay to the time to peak patency. In the displayed as well as a confirmatory experiment, only 6 of 14 mice infected with 5,000 oocysts were alive on day 14, whereas 11 of 14 mice infected with 100 oocysts were alive on day 14 (χ2 = 3.743, P = 0.053). All mice given 10 oocysts became infected. On day 12, mouse no. 3 and 4 were positive; on day 14, mouse no. 2 and 4 (but not no. 3) were positive; on day 16, mouse no. 1, 2, 5, 6, and 7 (but not no. 3 or 4) were positive; and on day 19, all mice were positive. Thus, when a 10-oocyst inoculum is used, shedding may initially be at the limits of detection, yet it still rises to the same level as in mice infected with a larger inoculum. CI, confidence interval.

