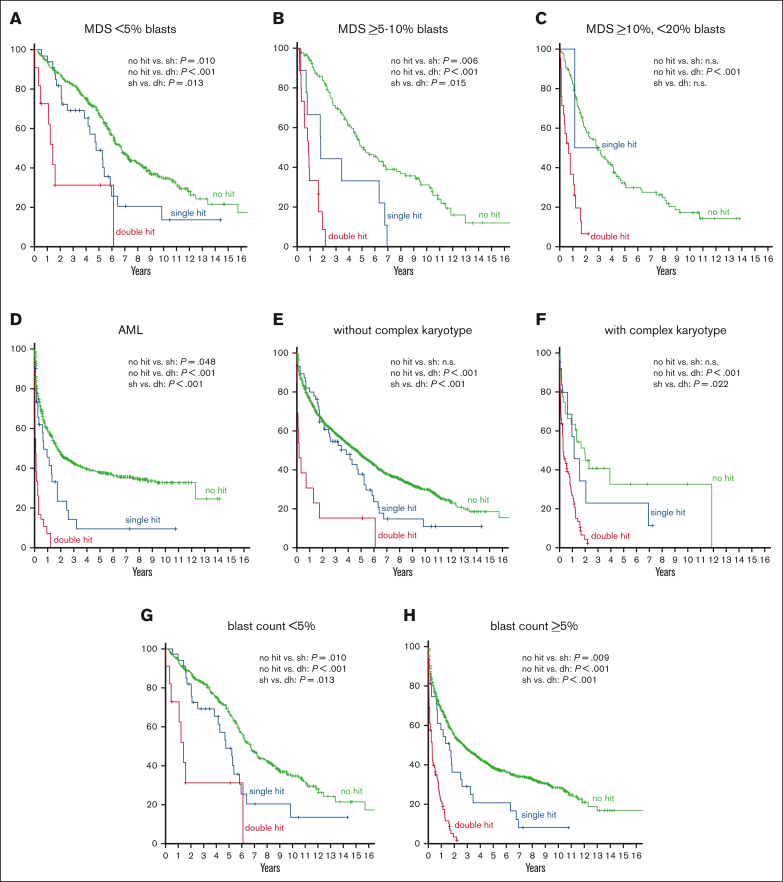
Figure 2.
OS analysis in respective AML and MDS subgroups. (A-D) OS in patients without TP53 alteration (green curve), TP53 single hit (blue), and TP53 double hit (red) in blast-dependent subgroups (MDS with <5% blasts, MDS with ≥5% but <10% blasts, MDS with ≥10% but <20% blasts, and AML). (E-F) OS in respective subgroups dependent on the presence of a complex karyotype. (G-H) OS in subgroups dependent on the blast count. P values are depicted and were considered significant at P ≤ .05.

