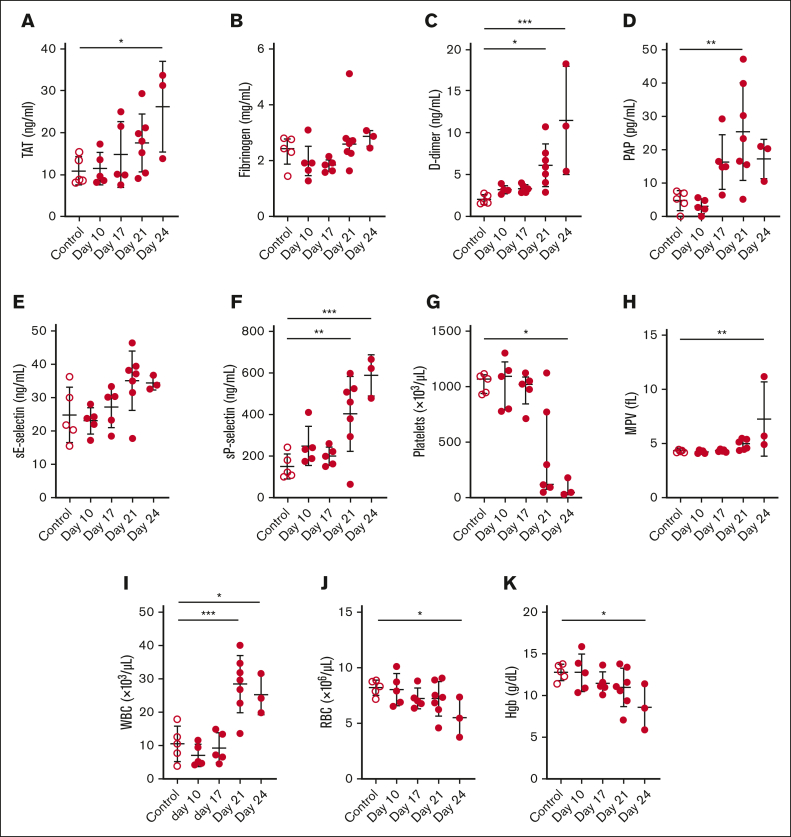
Figure 4.
Biomarker and blood cell levels in a mouse allograft model of APL. (A) TAT, (B) fibrinogen, (C) D-dimer, (D) PAP, (E) sE-selectin, (F) sP-selectin, (G) platelet count, (H) MPV, (I) WBC count, (J) RBC count, and (K) hemoglobin (Hgb) were measured in the plasma or whole blood of control and leukemic mice on days 10, 17, 21, and 24 (n = 3-7 per group). Two mice died on day 24. Data are shown as mean ± SD (A,C-F,H-K) or median ± interquartile range (B,G), depending on normality. The one-way analysis of variance with Dunnett multiple comparisons test (A,C-F,H-K) or the Kruskal-Wallis test with Dunn multiple comparisons test (B,G) was used, depending on the normality of data. ∗P < .05; ∗∗P < .01; ∗∗∗P < .001.

