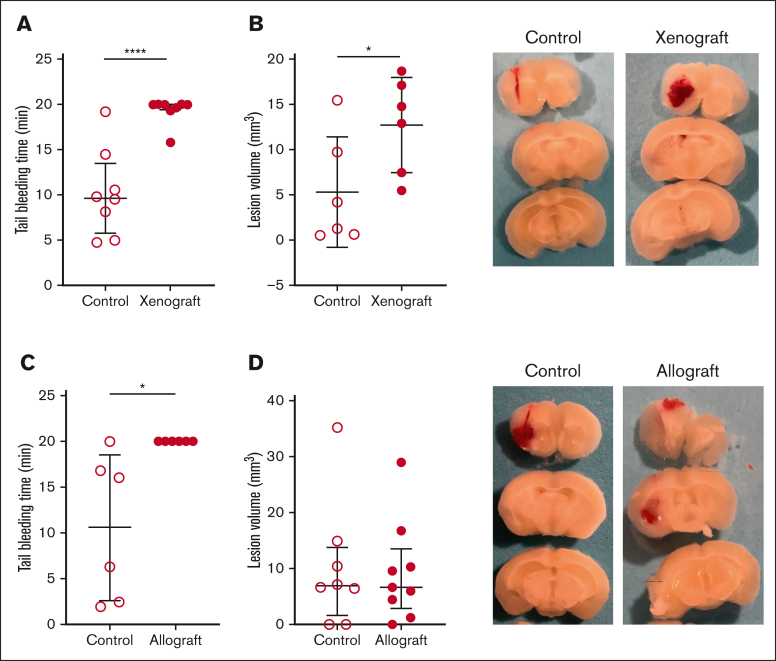
Figure 5.
Tail and brain bleeding in the mouse xenograft and allograft models of APL. The mice that received (A) xenograft (n = 8 per group) and (B) allograft (n = 6 per group) and the respective controls were subjected to tail bleeding on days 28 and 24, respectively. The mice that received (C) xenograft (n = 6 per group) and (D) allograft (n = 8-9 per group) and their respective controls were subjected to intracranial bleeding on days 28 and 24, respectively. Representative images of brain slices are shown. Data are shown as median ± interquartile range (A,D) or mean ± SD (B,C), depending on normality. The Mann-Whitney U test (A,D), unpaired 2-tailed Student t test (B), and Welch t test (C) were used. ∗P < .05; ∗∗∗∗P < .0001.

