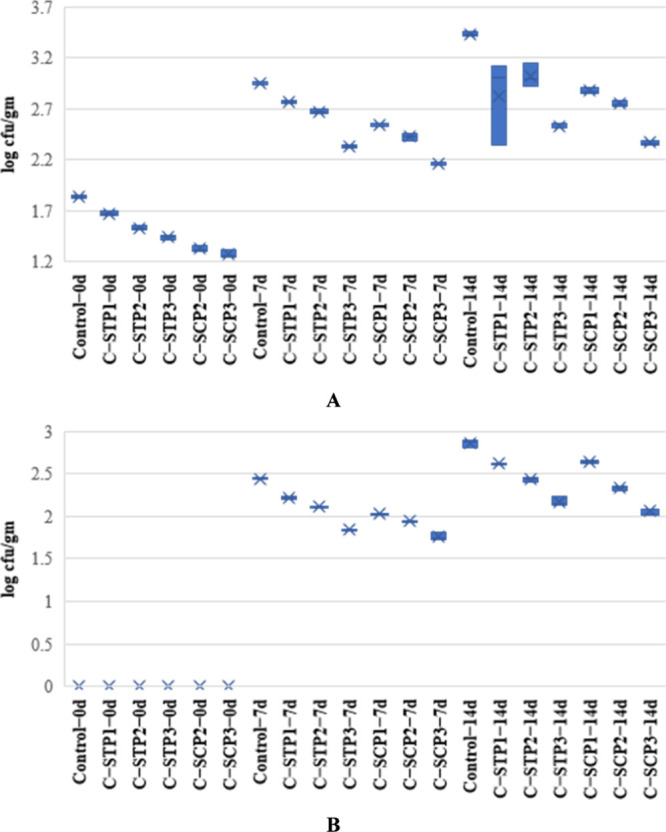
Figure 11.

Total bacterial count (A) and total mold and yeast count (B) per log cfu/g and in sponge cake fortified with different levels of spent coffee or tea during different storage periods. The data is represented as the mean ± SD of three replicates. C-SCP1, C-SCP2, and C-SCP3: cakes with the addition of 1, 2, and 3% spent coffee powder, respectively; C-STP1, C-STP2, and C-STP3: cakes with the addition of 1, 2, and 3% spent tea powder, respectively.
