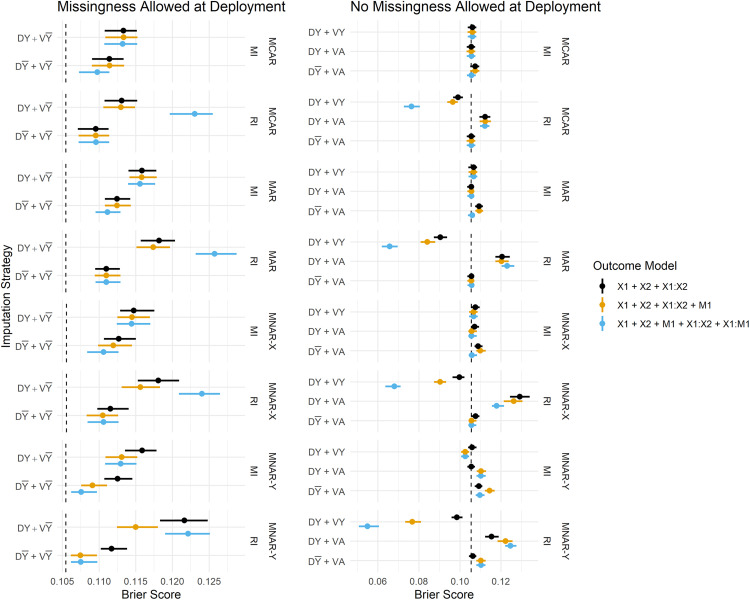
Figure 3.
Brier Score estimates across development/validation scenarios, imputation methods and missingness mechanisms. The vertical dashed lines represent estimates from the complete data scenario (DA + VA). DY = Y included in the imputation model at development, D = Y omitted from the imputation model at development, VY = Y included in the imputation model at validation, V = Y omitted from the imputation model at validation, DA = complete data available at model development, VA = complete data available at validation.

