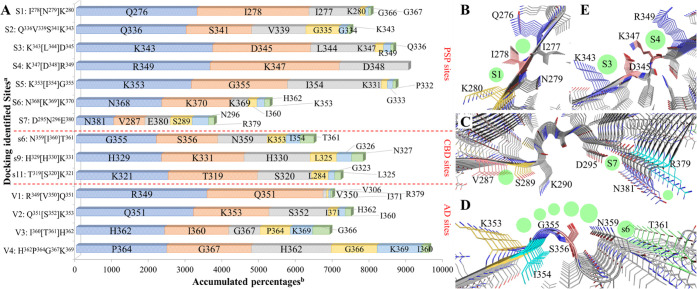
Figure 3.
Overview of the surface residues that come into contact with tracers during the 100-ns MD simulations. (A) Statistical data of the contacts. A threshold distance of 4.0 Å between the non-hydrogen atoms of the protein residues and tracers was used to count the contacts. The top 6 most contacting residues are depicted. aConfiguration of each docking identified site is given for comparison. bPercentages are accumulated from the MD simulations of each tracer over all of the protofibril chains. (B), (C), and (D) Configurations of new sites (green spheres) in the MD simulations of docked sites (green spheres with labels) S1, S7, and s6, respectively. (E) Comparison of the sites S4 and S3 on the PSP protofibril.

