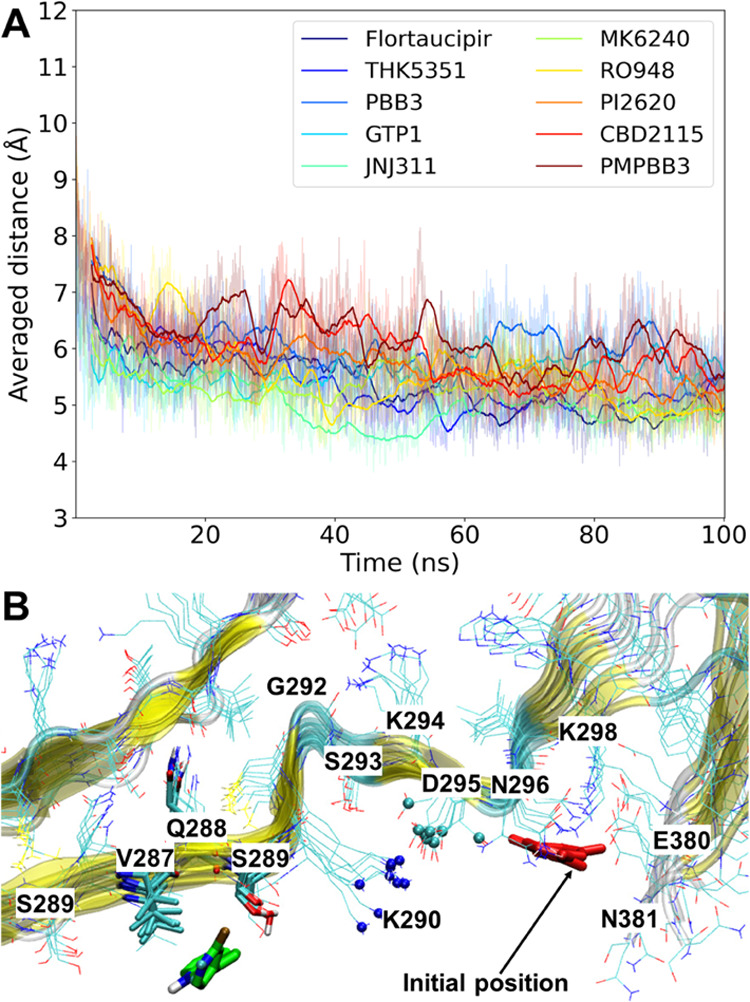
Figure 4.

(A) Time course of the averaged distance of the “NZ” atoms of K290 and the “CG” atoms of D295 for all of the 9 chains during the 10 MD simulations with different tracers at site S7. (B) Representative snapshot of PI2620 falling into site V287[Q288]S289 from the simulation starting from PSP site S7. The “NZ” atoms of K290 and “CG” atoms of D295 are depicted in blue and cyan spheres, respectively. PI2620 and the residues within 4.0 Å of PI2620 are rendered as cyan and green sticks, respectively.
