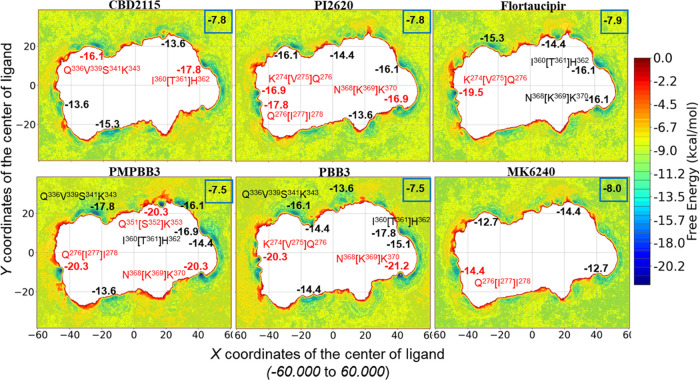
Figure 7.
Binding sites and free energy profiles from the 4.5-μs well-tempered metadynamics simulations for 6 selected tracers in PSP protofibrils. CV1: the X coordinates of the ligand centroid; CV2: the Y coordinates of the ligand centroid. The averaged free energy of the tracer in the solvent and the lowest free energy of some local minima are given in bold numbers with and without a blue frame box, respectively. The free energies of some top-ranked local minima are colored in red, with the label of their binding site configuration marked also in red. The orientation of the PSP protofibril is identical to the one depicted in Figure 1.

