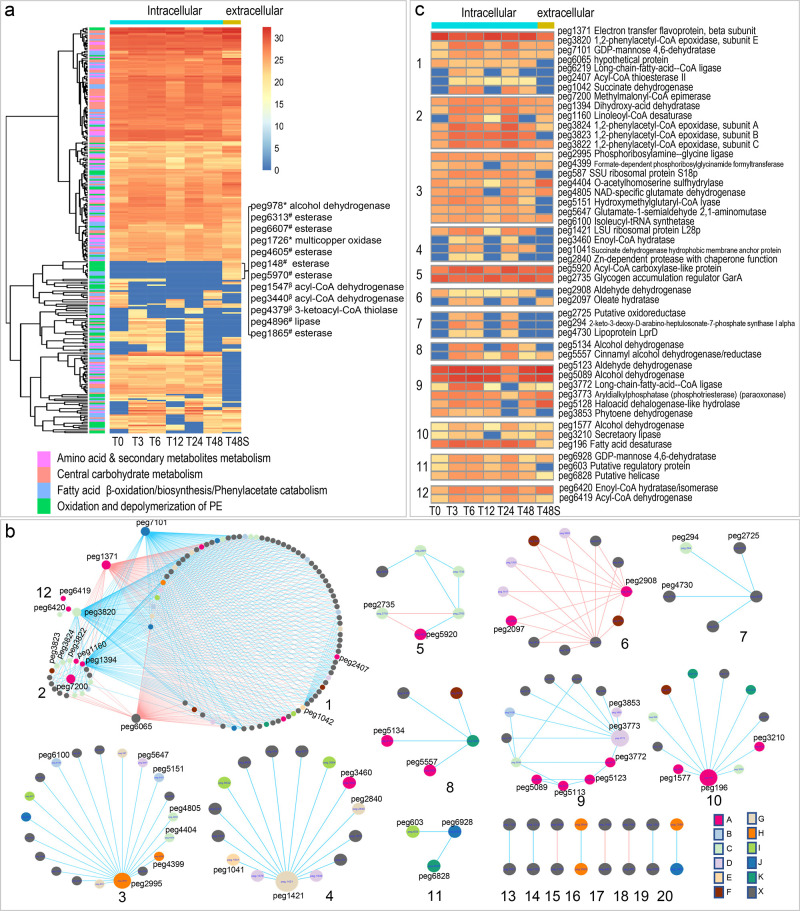
Figure 4.
Temporal protein abundance (log 2 transformed) changes of A 34 are shown in the heatmaps [(a) *, PE oxidation; #, PE depolymerization; β, fatty acid β-oxidation]. (b) Networks generated from the temporal proteomics data were partitioned into 20 module. Positive or negative correlations between nodes were shown in blue or red, respectively. Color key for the nodes: A, oxidation of fatty acids or biosynthesis of fatty acids; B, metabolism of amino acid and secondary metabolites; C, metabolism of amino acids; D, metabolism of the secondary metabolites; E, TCA cycle; F, ABC transporter; G, protein degradation; H, purine metabolism; I, regulatory protein; J, sugar metabolism; K, DNA modification; and X, other pathways or hypothetical protein. (c) Protein abundance changes of the interested enzymes in each module (module # is shown in the left of the heatmap).

