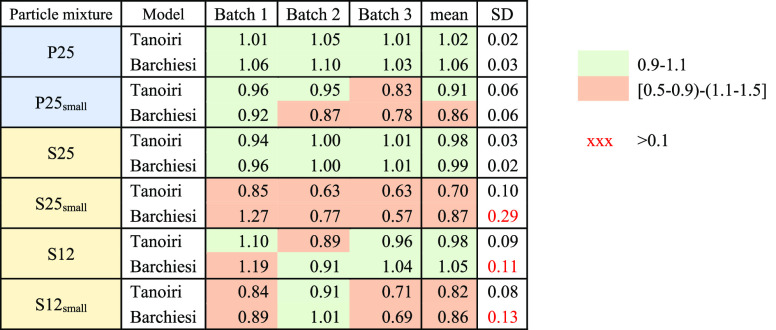
Table 3. Quality of the Tanoiri and the Barchiesi Models in Estimating Particle Volume, Expressed As the Ratio of Modeled and Measured Volume, Shown Per Batch (Average of Throws), with the Mean and Standard Deviation among Batchesa.
A ratio of 1 represents a perfect fit of the model to the measured data. “P” Primary MPs, “S” secondary MPs, “small” refers to samples of few particles (no. 3–16), “12”–“25” are the size range [1–2] mm and [2–5] mm respectively, as determined by sieving.

