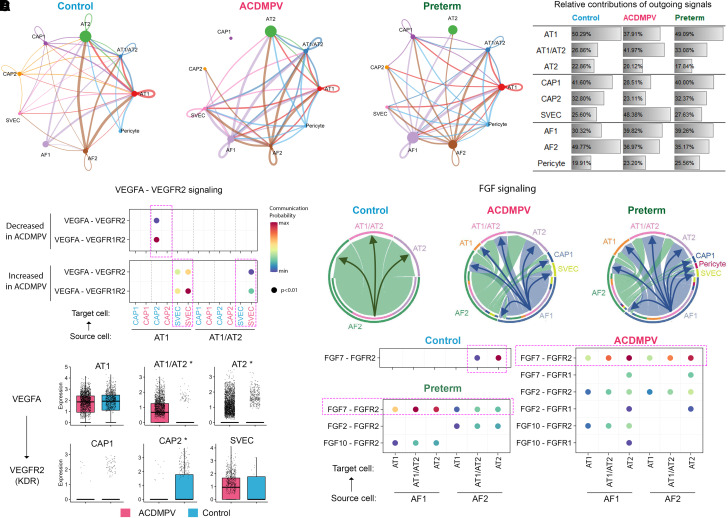
Figure 7.
Alterations in alveolar niche cell–cell communications in alveolar capillary dysplasia with misalignment of pulmonary veins (ACDMPV) lungs. (A) CellChat analysis predicted alterations in ligand receptor–based cell–cell communications among alveolar cell types in ACDMPV (middle) compared with control (left; 3 yr old) and preterm neonate (right; 1–4 d of age and 29–31 wk of gestational age) lungs. Edge thickness is proportional to the number of CellChat-inferred ligand–receptor interactions for each cell–cell pair. Shown are edges with the top 50% number of interactions. Edge color represents the cell type expressing the ligands. Node size is proportional to the number of cells in a cell type. (B) Relative contributions of outgoing signaling by each cell type in ACDMPV, control, and preterm neonate lungs. The relative contribution of a cell type was calculated as the total number of outgoing signals from the cell type divided by the total number of outgoing signals from the cell types of the same lineage. (C) Top: CellChat analysis predicted the loss of VEGFA (vascular endothelial growth factor A)–VEGFR2 (vascular endothelial growth factor receptor 2) signaling from alveolar type 1 (AT1) to capillary 2 (CAP2) cells and an increase in VEGFA–VEGFR2 signaling from AT1 and AT1/AT2 to SVECs in ACDMPV lungs. Node color represents normalized communication probability calculated using CellChat. Label colors represent cell types in ACDMPV (red) or in control (blue) lung. Bottom: differential expression of VEGFA in epithelial cells and KDR in endothelial cells in snRNA-seq of ACDMPV versus control lungs. The asterisk represents gene expression changes satisfying the following criteria: P value of two-tailed Wilcoxon rank sum test < 0.05, expression percentage ⩾ 20%, and fold change of average expression or expression percentage ⩾ 1.5. (D) CellChat analysis predicted an increase in FGF (fibroblast growth factor) signaling from AF1 cells to alveolar epithelial cells in ACDMPV lungs. Top: FGF signaling among alveolar cell types in the control, ACDMPV, and preterm lungs. Edge thickness is proportional to the normalized aggregated communication probabilities of significant FGF ligand–receptor interactions for a cell–cell pair. Edges are from source to target cells. Bottom: significant (P < 0.01) FGF ligand–receptor interactions inferred by CellChat using snRNA-seq of control, ACDMPV, and preterm lungs. Node color represents normalized communication probability. AF1 = alveolar fibroblast 1; AF2 = alveolar fibroblast 2; AT1/AT2 = AT1/AT2 transitional cell; AT2 = alveolar type 2 cell; CAP1 = capillary 1 cell; FGFR=fibroblast growth factor receptor; KDR = kinase insert domain receptor; snRNA-seq = single-nucleus RNA sequencing; SVEC = systemic vascular endothelial cell.

