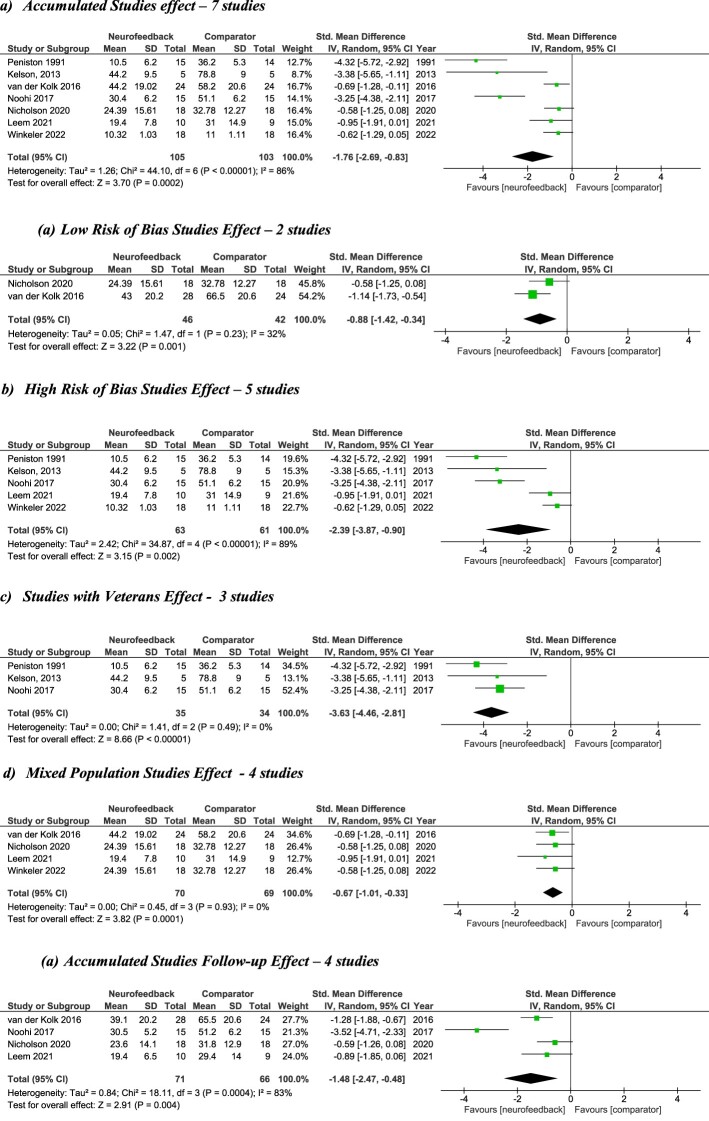
Figure 2.
Forest plots showing change in severity of symptoms of PTSD after treatment with Neurofeedback vs control conditions. ‘Std. Mean Difference’ indicates the effect size, with 95% confidence intervals (C.I.s). The Z value and associated p value indicate whether the effect size differs significantly from zero. The squares in the figure indicate the weight of the particular study in the meta-analysis. SD, Standard deviation; IV, inverse variance; df, degrees of freedom.

