
Figure 1.
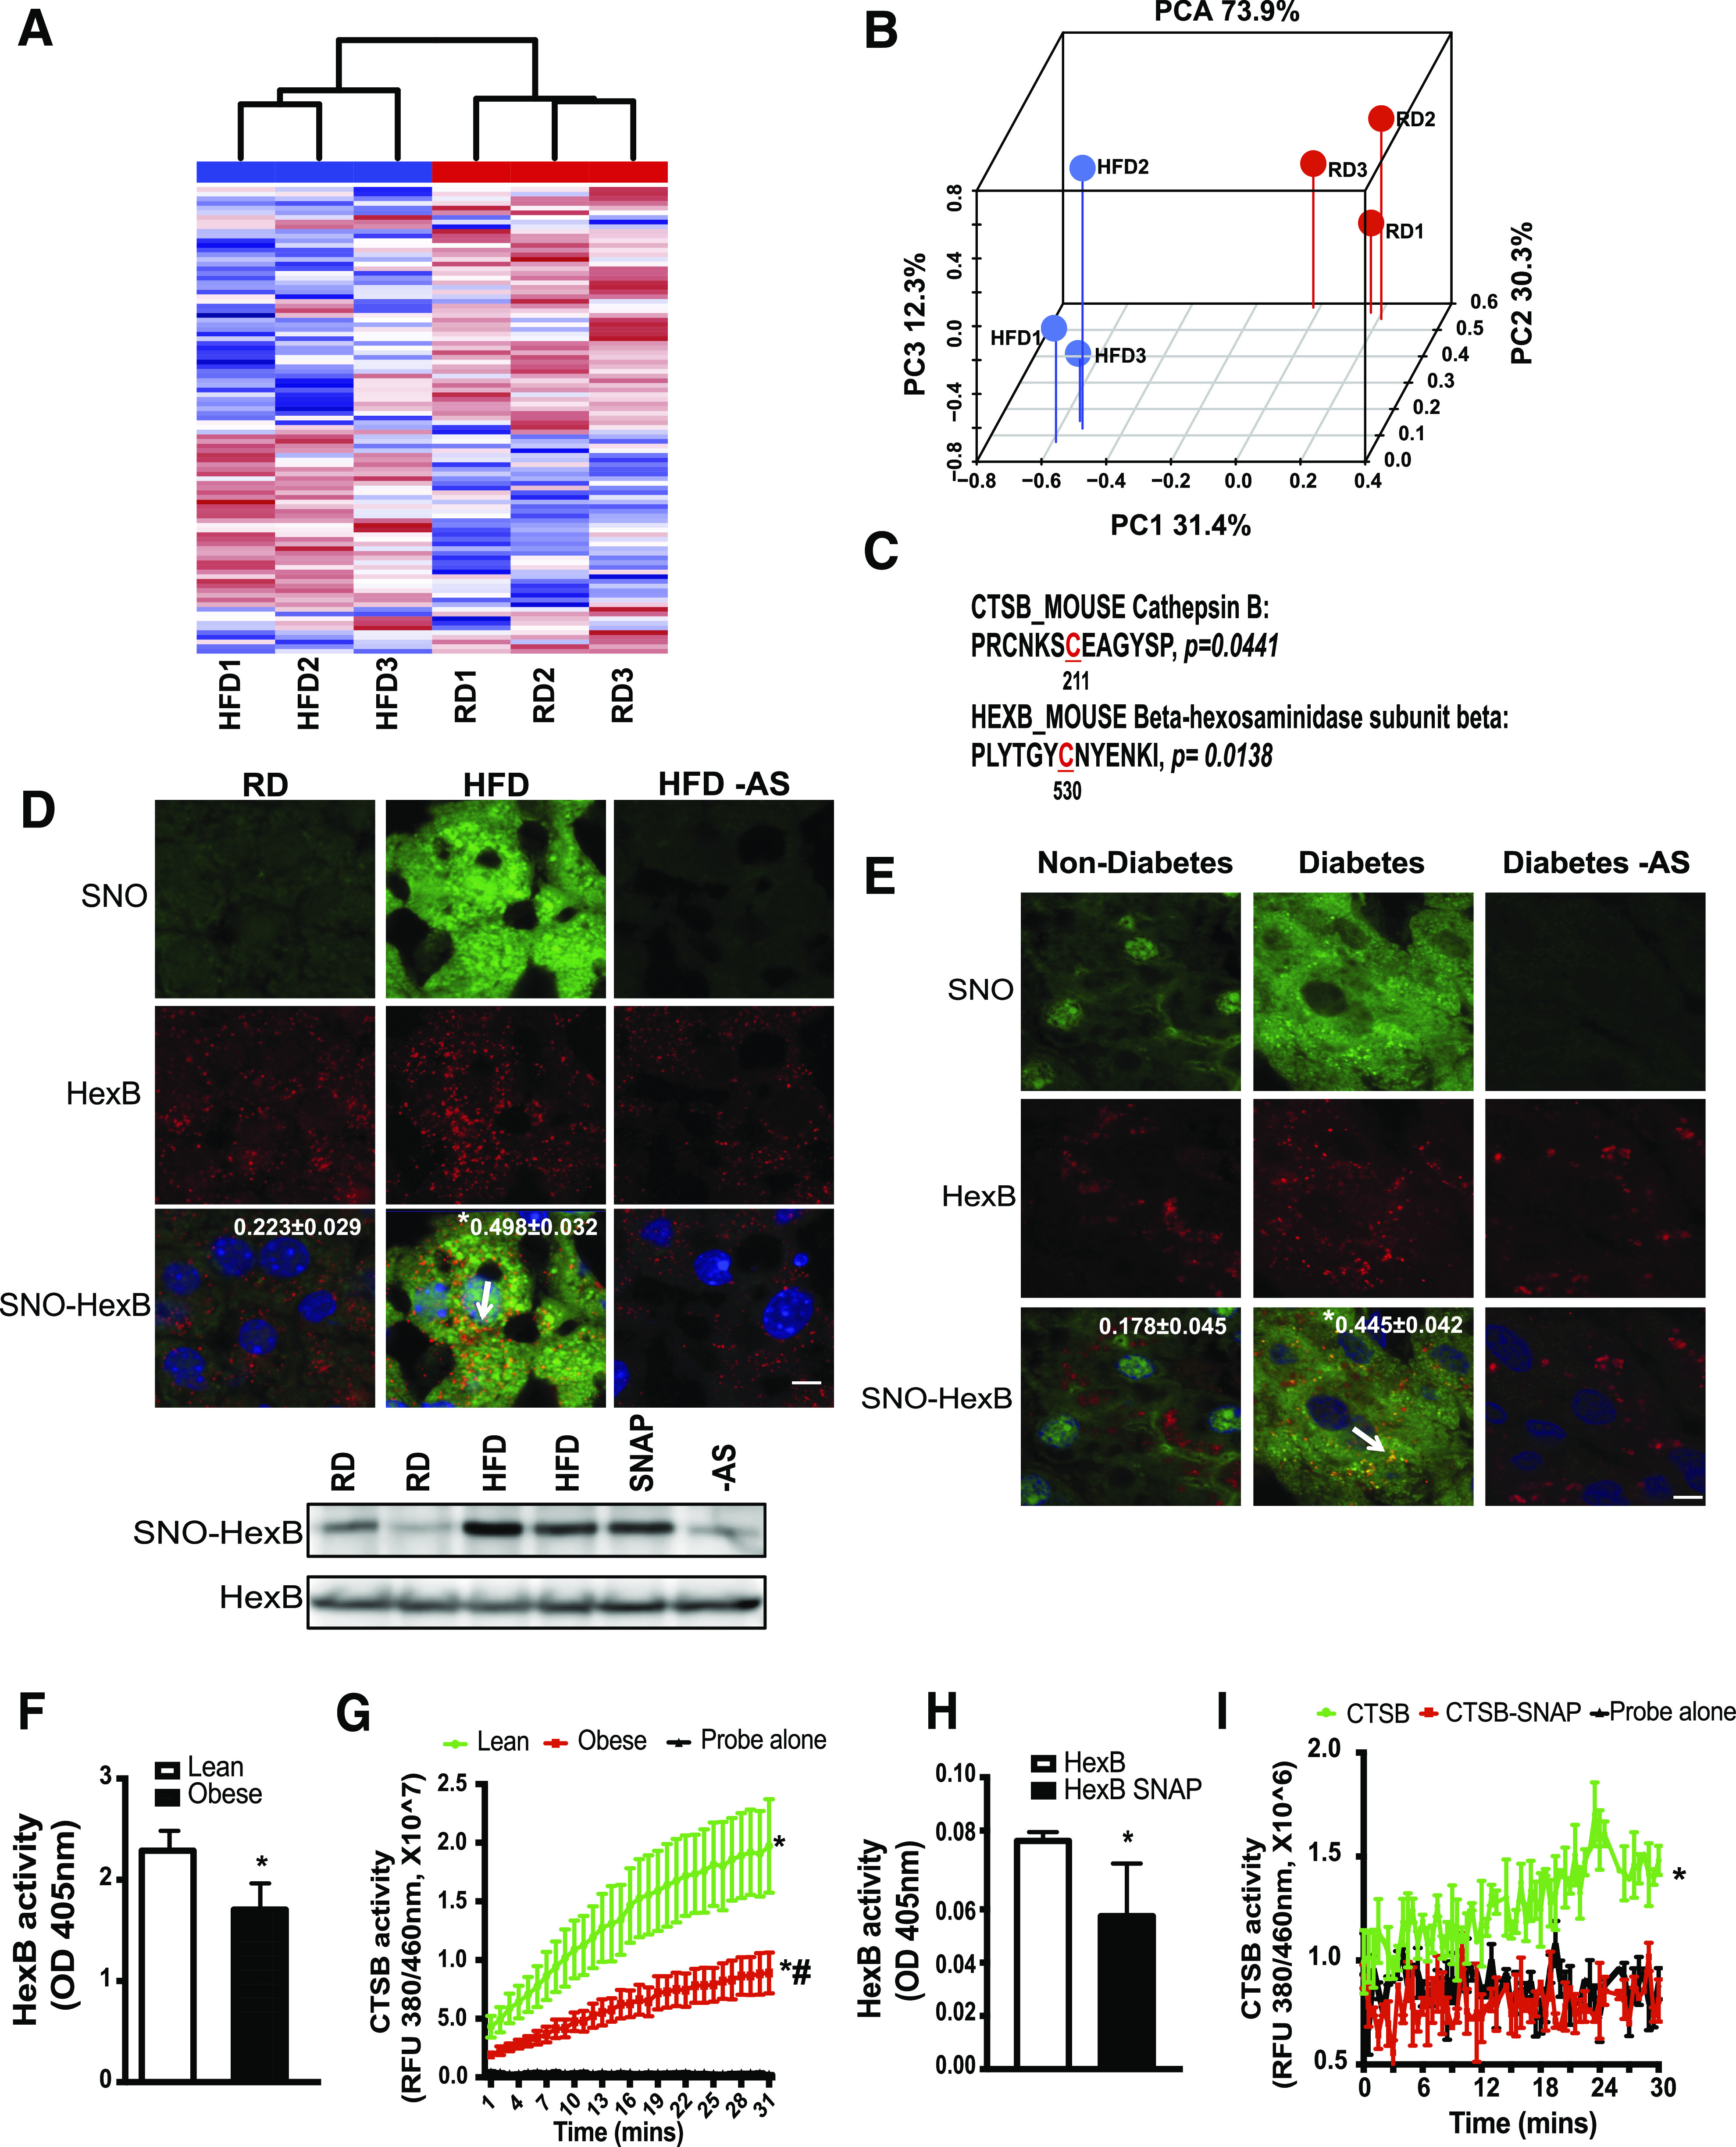
Obesity results in S-nitrosylation of lysosomal enzymes. A: Hierarchical clustering of S-nitrosylated (SNO) proteins in the livers of mice on the RD and HFD (n = 3, 16 weeks on HFD). S-nitrosylated proteins were labeled with iodoTMT and subjected to liquid chromatography–MS/MS-based proteomics. B: Top differential expressed 100 targets were selected for hierarchical clustering and principal component analysis (PCA). C: Lysosomal targets whose S-nitrosylation is significantly increased in the livers from mice fed with an HFD and the corresponding sites of S-nitrosylation. S-nitrosylated proteins that are deferentially expressed between the RD and HFD groups were used for GO and KEGG category classification. The sites of S-nitrosylation are indicated in red and numbered. D: top panel: Representative images (63×) of staining for S-nitrosylated HexB in the livers from mice fed with an RD or HFD (16 weeks on an HFD). S-nitrosylation staining was performed by a modified in situ biotin switch method. Blue, DAPI; green, S-nitrosylation; red, HexB. Arrow points to S-nitrosylated HexB. AS, ascorbate omitted (negative control for S-nitrosylation). Scale bar, 10 μm. Quantified colocalizations of S-nitrosylated HexB are shown on the top of each image. Data are shown as a Pearson correlation coefficient as the mean ± SEM. *Statistically significant difference relative to lean condition determined by Student t test (n = 3, P < 0.05). D, bottom panel: Representative Western blotting for S-nitrosylated HexB and input of HexB in livers. Each lane is a sample from an individual mouse. E: Representative images (63×) of staining for S-nitroyslated HexB in the livers from patients without diabetes and patients with diabetes. Blue, DAPI; green, S-nitrosylation; red, HexB. Arrow is S-nitrosylated HexB. Scale bar, 10 μm. Quantified colocalizations of S-nitrosylated HexB are shown on the top of each image. Data are shown as Pearson correlation coefficient as the mean ± SEM. *Statistically significant difference relative to nondiabetic condition determined by Student t test (n = 3, P < 0.05). F and G: HexB and CTSB activities in lysosomal fractions from lean and ob/ob mice (obese, 10 weeks old; n = 3). Same amount of liver tissues from lean and obese mice were used. Data are presented as the mean ± SEM. *Statistically significant difference relative to lean condition determined by Student t test (P < 0.05) (F). *Statistically significant difference relative to probe alone and #statistically significant difference relative to lean condition; analysis of the area under the curve (AUC) was performed by ANOVA with post hoc test (P < 0.05) (G). In vitro enzyme activity assays for HexB (H) and CTSB (I). Recombinant HexB (0.15 ng) or CTSB (10 ng) was used in the absence or presence of SNAP (10 mmol/L, 20 min). All data are presented as the mean ± SEM. *Statistically significant difference relative to samples without SNAP treatment, as assessed by Student t test (P < 0.05) (H), and analysis of the AUC was performed by ANOVA with post hoc test (P < 0.05) (I). OD, optical density; RFU, relative fluorescence units.