
Figure 3.
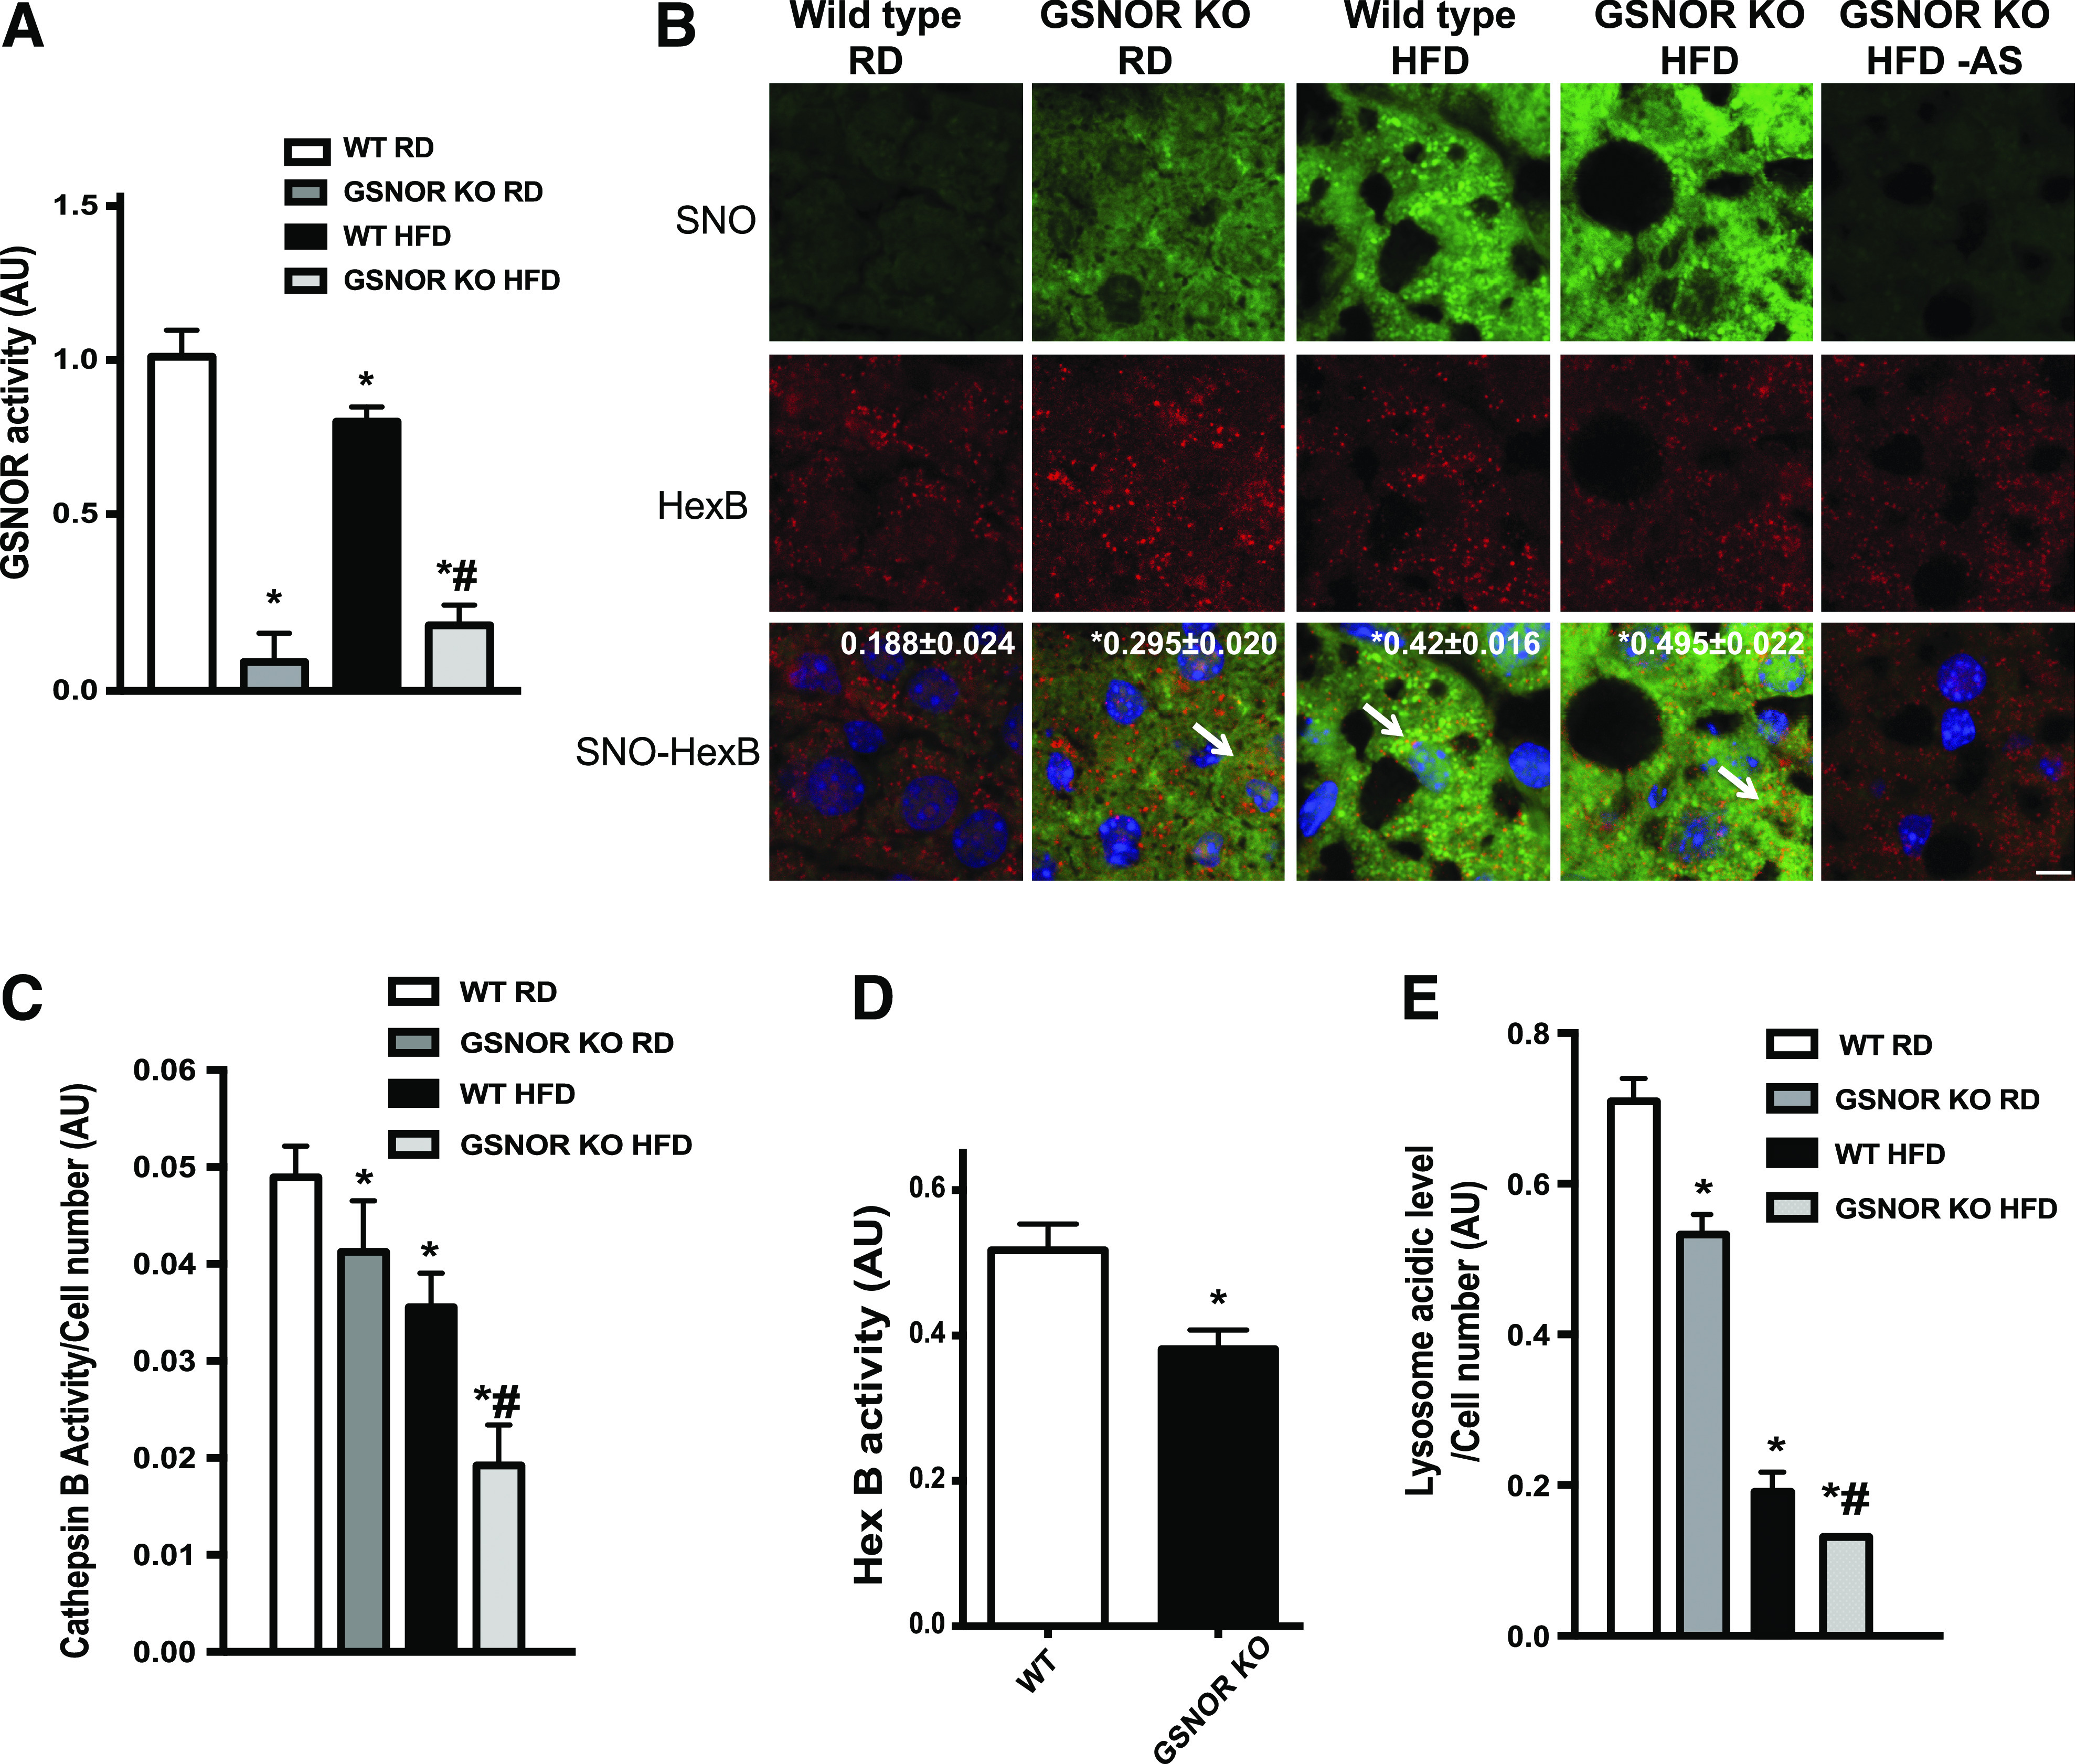
GSNOR deficiency results in impaired lysosomal function. A: GSNOR activities in the livers (n = 3) of WT and GSNOR KO mice on the RD or HFD (16 weeks). The resulting GSNOR activity was first normalized to the area under the curve of samples without GSNO then was normalized to those for the WT RD group; and results are presented as the mean ± SEM. *Significant difference relative to WT RD; #statistically significant difference between WT and GSNOR KO groups on the HFD determined by ANOVA followed by post hoc test (P < 0.05). B: Representative confocal images (63×) of staining for S-nitrosylation in liver sections from WT and GSNOR KO mice. Blue, DAPI; green, S-nitrosylation; red, HexB. Arrows are S-nitrosylated (SNO) HexB. Scale bar, 10 μm. Quantified colocalizations of S-nitrosylated HexB are shown on the top of each image. Data are shown as a Pearson correlation coefficient as the mean ± SEM. *Indicates statistically significant difference relative to WT RD determined by ANOVA followed by post hoc test (P < 0.05). C: CTSB activity measured in primary hepatocytes isolated from WT and GSNOR KO mice (n = 3; 16 weeks on HFD). Autophagy was induced by EBSS (4 h). *Indicates statistical significance compared with EBSS treatment in WT RD; #indicates statistical significance within WT and GSNOR KO groups on the HFD (determined by ANOVA followed by post hoc test) (P < 0.05). D: HexB activities in the primary hepatocytes isolated from WT and GSNOR KO mice on the RD (n = 3). All data are presented as the mean ± SEM. *Indicates statistical significance compared with WT group by Student t test (P < 0.05). E: Lysosomal acidity in live primary hepatocytes from WT and GSNOR KO mice on the RD or HFD (n = 3; 16 weeks on the HFD). Autophagy was induced by EBSS (4 h). *Indicates statistical significance compared with EBSS treatment in WT mice on the RD; #indicates statistical significance within WT and GSNOR KO groups on the HFD determined by ANOVA followed by post hoc test (P < 0.05). AU, arbitrary units; AS, ascorbate omitted.