
Figure 6.
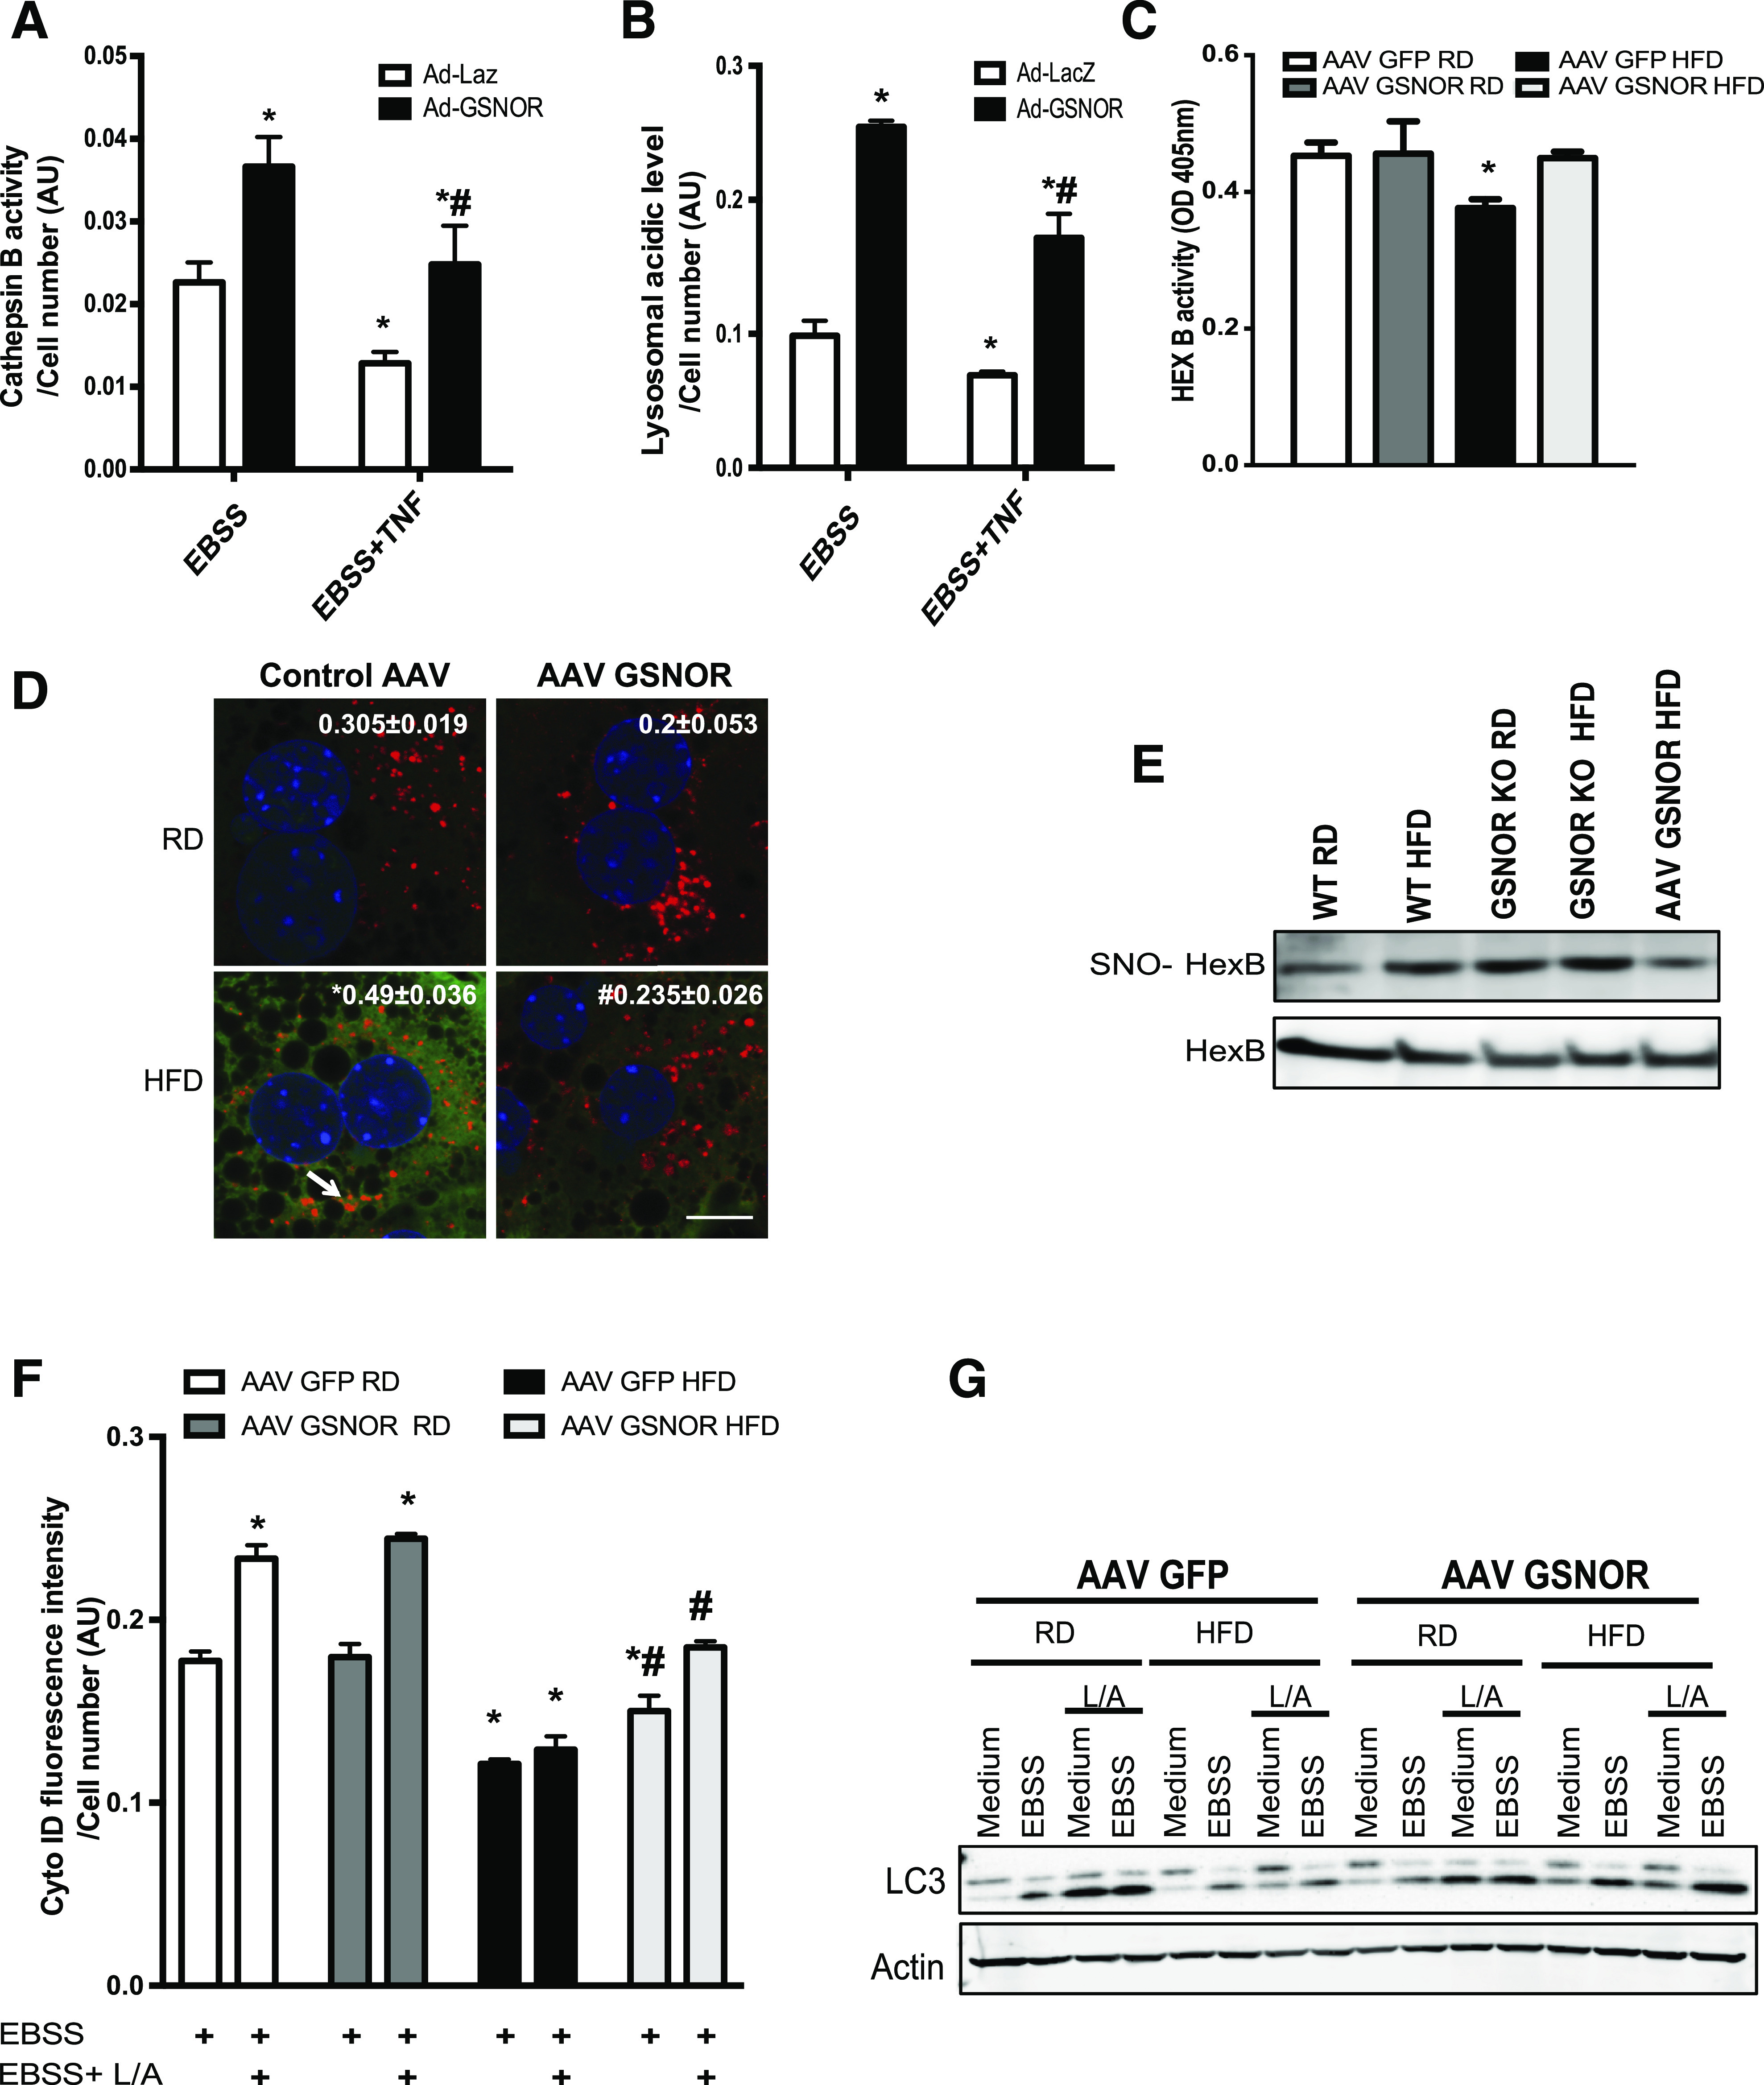
Amelioration of nitrosative stress by GSNOR improves hepatic lysosomal function and autophagy in obesity. CTSB activity (A) and lysosomal acidity (B) in live primary hepatocytes isolated from GSNOR KO mice (n = 3, fed on RD) transduced with control (Ad-LacZ) or Ad-GSNOR. Cells were treated with EBSS with or without pretreatment of tumor necrosis factor (10 ng/mL, 16 h). All data are presented as the mean ± SEM. *Indicates statistical significance compared with Ad-LacZ group determined by ANOVA followed by post hoc test (P < 0.05); #indicates statistical significance between Ad-GSNOR groups determined by ANOVA followed by post hoc test (P < 0.05). C: HexB activity in the primary hepatocytes isolated from WT mice transduced with AAV GSNOR vs. control virus and raised on an RD or an HFD (n = 3, 12 weeks on HFD). All data are presented as the mean ± SEM. *Indicates statistical significance compared with AAV GFP RD, determined by ANOVA with post hoc test (P < 0.05). D: Representative confocal images (63×) of staining for S-nitrosylation in primary hepatocytes from WT mice transduced with AAV GSNOR. Red, HexB; green, S-nitrosylation; blue, DAPI. Arrow points to S-nitrosylated HexB. Scale bar, 10 μm. Quantified colocalizations of S-nitrosylated (SNO) HexB are shown on the top of each image. Data are shown as Pearson correlation coefficient as the mean ± SEM. *Indicates statistically significant difference relative to AAV GFP RD; #indicates statistical significance between HFD groups determined by ANOVA followed by post hoc test (P < 0.05). E: S-nitrosylation of HexB in livers from WT mice, GSNOR KO mice, and WT overexpressing GSNOR and raised on the RD or HFD. Each lane used a mixture of protein lysates from three mice. F: Autophagic vacuoles in live primary hepatocytes from WT mice transduced with AAV GSNOR or AAV GFP and raised on the RD or HFD (n = 3) for 12 weeks, as detected using a Cyto-ID Kit. Cells were treated with EBSS (4 h); 20 mmol/L ammonium chloride and 100 mmol/L leupeptin (L/A; 4 h) were used to inhibit lysosomal degradation. All data are presented as the mean ± SEM. *Indicates statistical significance compared with AAV GFP RD in EBSS treatment; #indicates statistical significance between HFD groups determined by ANOVA followed by post hoc test (P < 0.05). G: LC3 conversion (arrow, LC3-II) in the primary hepatocytes from livers from WT mice with GSNOR overexpression. EBSS (4 h) was used to induce autophagy; 20 mmol/L ammonium chloride and 100 mmol/L leupeptin (4 h) were used to inhibit lysosomal degradation. Each lane contains a mixture of protein lysates from three mice. AU, arbitrary units; OD, optical density.