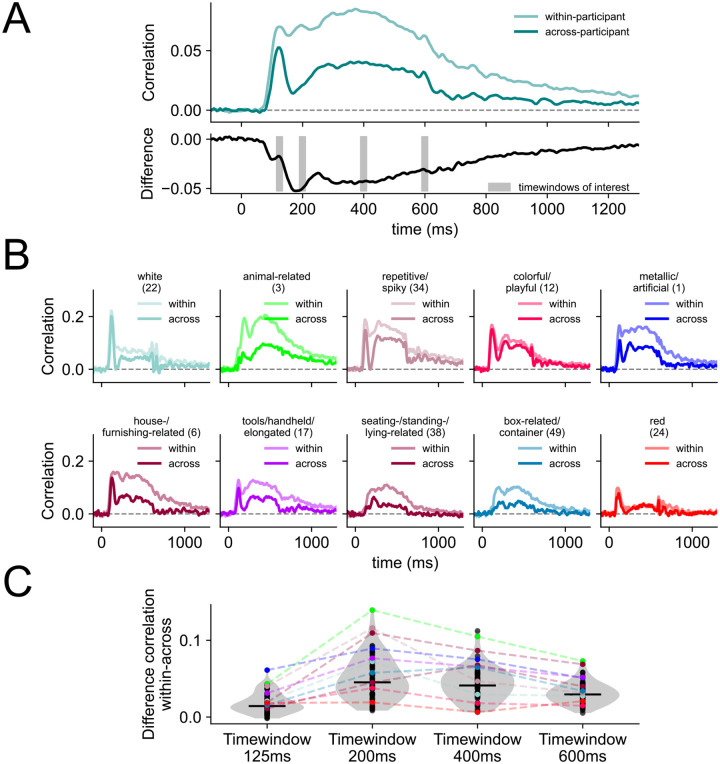
Figure 3. Differences between within- and across-participant model.
(A) Average performance of the model across all dimensions when fitted as a within-participant model (session-wise cross-validation) and an across-participant model (participant-wise cross-validation). The black line below shows the difference between the two. Timewindows of interest around 125 ms, 200 ms, 400 ms, and 600 ms are highlighted which we used to examine the differences between the within- and across-participant model in more detail (see C). (B) Each subplot shows an example dimension timeseries when the model is fit within each participant (light color) and across different participants (dark color). (C) Comparison of the differences between the within- and the across-participant model at four timewindows of interest. We selected the first timewindow based on the peak within-participant correlation, and then additional timewindows at regular intervals. Every dot shows the difference between the within and across model for each of the 66 dimensions. The example dimensions from (B) are highlighted in their corresponding colors.

