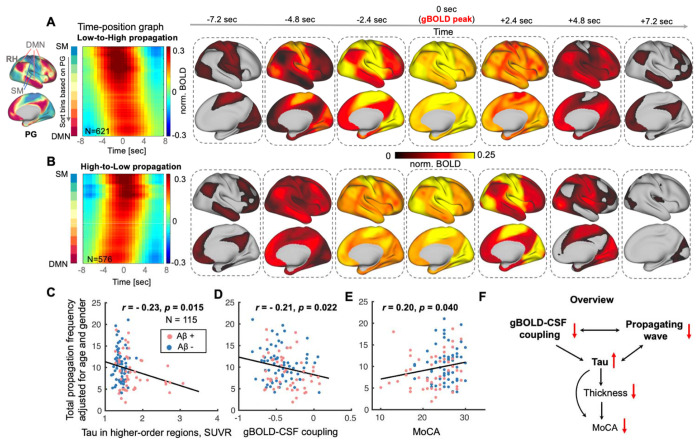
Fig. 5. Brain propagation dynamics involved with higher-order cortices are linked to tau, coupling metrics, and cognitive measures.
(A-B) Propagations between lower-order sensory-motor (SM) and higher-order association cortex were identified near gBOLD peaks as previously described (47). The two group-mean time-position graphs are shown as two types of continuous titled bands reflecting brain activation gradually transiting from low-to-high (L-H) order or in the opposite direction, which are shown as spatial pattern changes in the right seven columns. (C-E) The frequency of all identified propagation events (sum of the propagation frequency of both low-to-high and high-to-low (H-L); extracted within an equal length of fMRI time-series for each subject; adjusted for age and sex) decreased with the increase of tau deposition in higher-order regions, weaker gBOLD-CSF coupling, and the MoCA decline, across all subjects (all p < 0.040). This propagation-coupling relationship was also strong for Aβ+ and impaired Aβ+ subjects (Fig. S9; both r < − 0.26, both p < 0.068), similar to Fig. 1 and 2. (F) An overview summarizes the links among coupling metrics, dynamic propagation, and AD markers including thickness, tau, and MoCA. It shows that the glymphatic function-related gBOLD-CSF coupling and dynamic propagating waves modulate tau deposition, cortical thickness, and the cognitive changes, while the propagation frequency and thickness (also in higher-order association regions) was not significantly correlated (r = 0.10, p = 0.27). Each point in scatter plots represents one subject.

