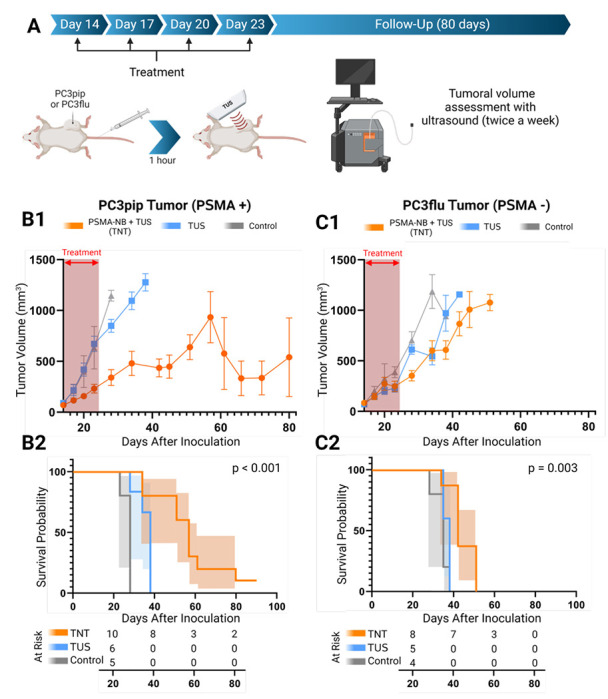
Figure 4.

Schematic diagram of the experimental setup and timeline (A). Tumor growth curve (mean ± SEM) of PSMA+ tumor mice (PSMA+ TNT (n=10), PSMA+ TUS (n=6), PSMA+ control (n=5)) (B1) and PSMA− tumor mice (PSMA− TNT (n=8), PSMA− TUS (n=5), PSMA− control (n=5)) (C1) after treatment. Survival curve with 95% C.I. (shaded area) of PSMA+ tumor (B2) and PSMA− tumor-bearing mice (C2) after TNT treatment. Red dashed arrows indicate the days treatment was performed. P-values for log-rank test. Bothe TNT and TUS-Only treatments were applied every 3 days starting from 14th day to 24th day (four treatments) after tumor inoculation.
