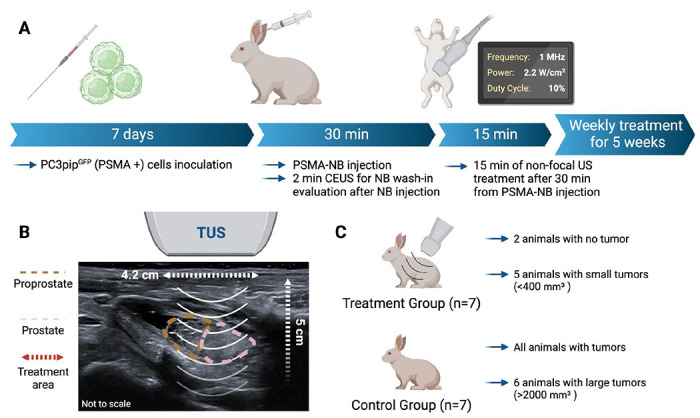
Figure 5 .

Schematic diagram of the weekly treatment protocol for the rabbits (A). Diagram showing the positioning of the therapeutic ultrasound (TUS) based on the B-mode imaging and illustrating the area of TUS treatment (4.2 cm diameter and 5 cm depth) (B). Summary of the results by group showing that the treatment group presented with less and smaller tumors then the control group (C).
