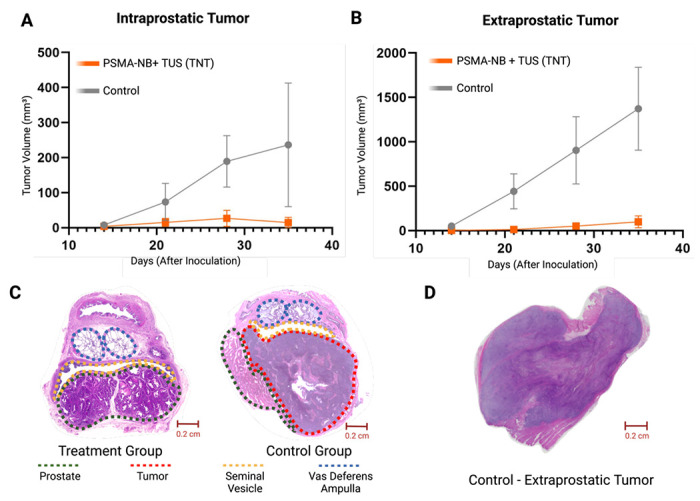
Figure 6.

Tumoral growth of intraprostatic tumors (mean ± SEM) (A) and extraprostatic tumors (B) comparing the treatment (PSMA-NB + TUS) and control groups. Representative histology slides (H&E stained) of the prostate gland of the treatment group with no tumor (left) and the control (right) with a large tumor highlighted by the red dashed line (C). Representative histology of an extraprostatic tumor in the control group (PSMA-NB only, no TUS) (D).
