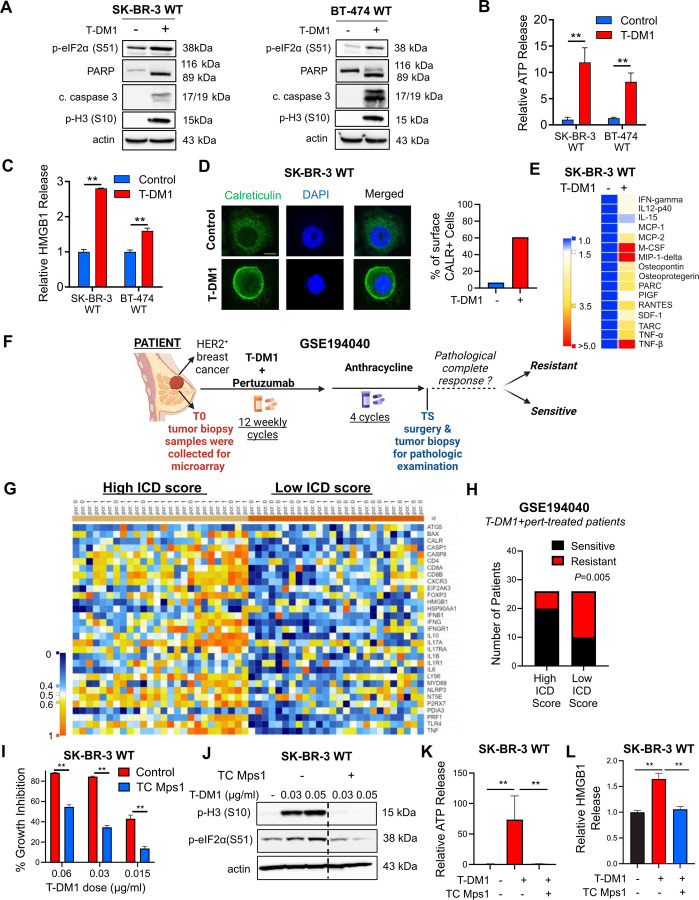
Figure 1. T-DM1 induces ICD markers in T-DM1 sensitive breast cancer cells in a mitotic arrest-dependent manner and ICD correlates with T-DM1 sensitivity in patients.
A Western blot analysis of mitotic arrest, apoptosis and ICD markers in T-DM1-treated SK-BR-3 WT (left) and BT-474 WT (right) cells. B, C Relative ATP release (B) and HMGB1 release (C) from T-DM1-treated SK-BR-3 WT and BT-474 WT cells (n=3, 4). D IF cell surface staining of calreticulin (green) in T-DM1 treated SK-BR-3 WT cells. Scale bar=10 µm. DAPI was used to stain the nucleus. Its quantification is provided on the right. E Cytokine array blot analysis showing the differentially secreted cytokines in T-DM1-treated SK-BR-3 WT cells. F. Schematic summary of the treatment scheme and the sample collection timeline in GSE19404026. This figure was drawn using Biorender.com. G. Heatmap of ICD-related genes found in the ICD gene signature score28 and their correlation with pCR in T-DM1+pertuzumab-treated patients from GSE194040. pCR: 1, sensitive; pCR: 0, resistant. H. Chi-square analysis of sensitive vs. resistant tumors expressing low vs. high ICD score from G. I Percent growth inhibition in SK-BR-3 WT cells treated with T-DM1 alone or in combination with 1 µM TC Mps1 (Mps1 inhibitor) (n=4). J Western blot analysis of p-H3 and p-eIF2α in SK-BR-3 WT cells treated with T-DM1 alone or in combination with 1 µM TC Mps1. Actin is used as a loading control. K, L Relative ATP (K) and HMGB1 (L) release in SK-BR-3 WT cells treated with T-DM1 alone or in combination with 1 µM TC Mps1 (n=3). Data correspond to mean values ± standard deviation (SD). P-values for the bar graphs were calculated with the unpaired, two-tailed Student’s t test. Significance for the Chi-square analysis was calculated with Chi-square testing. **, P<0.01.

