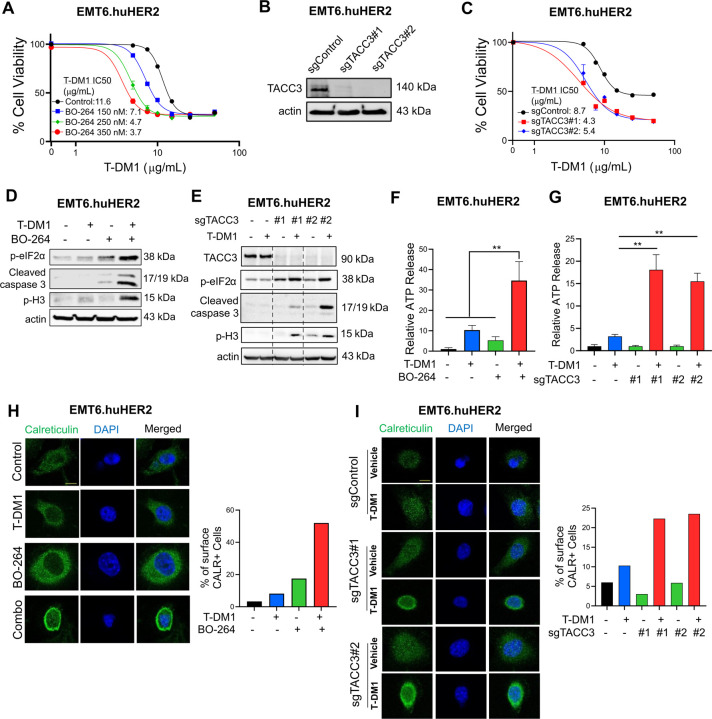
Figure 3. Targeting TACC3 sensitizes the human HER2-expressing EMT6.huHER2 cells to T-DM1 and induces ICD markers.
A Cell viability assay in EMT6.huHER2 cells treated with increasing doses of T-DM1 alone or combination with different dose of BO-264 for 3 days (n=4). B Validation of TACC3 knockout in EMT6.huHER2 cells obtained using CRISPR/Cas9 system. C Cell viability assay in EMT6.huHER2.sgTACC3 vs. sgControl cells treated with increasing doses of T-DM1 for 3 days (n=4). D Western blot analysis of mitotic arrest, apoptosis and ICD markers in EMT6.huHER2 cells treated with T-DM1 alone or in combination with BO-264. Actin is used as a loading control. E. Western blot analysis of TACC3, mitotic arrest, apoptosis, and ICD markers in EMT6.huHER2.sgTACC3 vs. sgControl cells treated with T-DM1. Actin is used as a loading control. F Relative ATP release from EMT6.huHER2 cells treated with T-DM1 alone or in combination with BO-264 (n=3). G Relative ATP release from EMT6.huHER2.sgTACC3 vs. sgControl cells treated with T-DM1 (n=3, 4). H IF cell surface staining of calreticulin (green) in EMT6.huHER2 cells treated with T-DM1 alone or in combination with BO-264. Its quantification is provided on the right. I IF cell surface staining of calreticulin (green) in EMT6.huHER2.sgTACC3 vs. sgControl cells treated with T-DM1. Its quantification is provided on the right. Data correspond to mean values ± standard deviation (SD). P-values were calculated with the unpaired, two-tailed Student’s t test. **, P<0.01.

