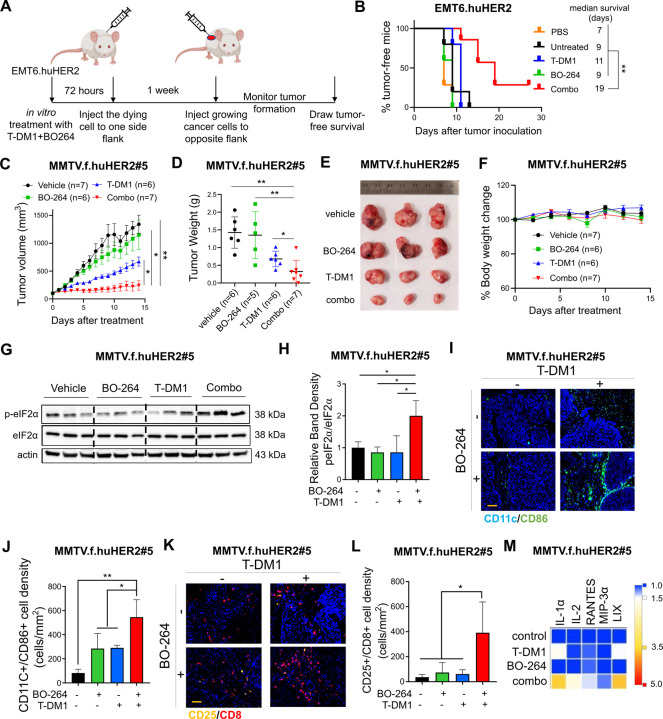
Figure 5. TACC3 inhibition elicits ICD in vivo and potentiates TDM1 response via increasing the infiltration of anti-tumor immune cells in vivo.
A Schematic representation of the in vivo vaccination assay drawn using Biorender.com. B Tumor-free survival curves of BALB/c mice vaccinated with PBS or single agent or combination treated EMT6.huHER2 cells (n=5–7). C Tumor growth of the MMTV.f.huHER2#5 model under low dose T-DM1 (5 mg/kg, once) in combination with BO-264 (50 mg/kg, daily) (n=6, 7). D Tumor weights of the mice in C after 14 days of treatment. E, F Representative resected tumor pictures (E) and body weights (F) from mice in C. G Western blot analysis of p-eIF2α and eIF2α protein expression levels in tumors from C. Actin is used as a loading control. H Relative band density graphs for p-eIF2α normalized to eIF2α from G (n=3). I, J Multiplex IF staining of CD11c/CD86 and CD25/CD8 in short-term-treated MMTV.f.huHER2#5 tumors and its quantification (n=3). K, L Multiplex IF staining of CD11c/CD86 and CD25/CD8 in short-term-treated MMTV.f.huHER2#5 tumors and its quantification (n=3). Scale bar=100 µm. M Levels of the cytokines in the serums of the mice with short-term-treated MMTV.f.huHER2#5 tumors (n=3). Data for the bar graphs and box plots correspond to mean values ±SD, while data for the tumor volume and body weight graphs correspond to mean values ± standard error of the mean (SEM). End-point criteria for mice in C and F are treatment for 14 days or until reaching ethical tumor size cut-off. P-values for the bar graphs and box plots were calculated with the unpaired, two-tailed Student’s t test. Significance for the tumor volume graph and multiplex IHC quantification was calculated with two-way and one-way ANOVA, respectively. *, P<0.05; **, P<0.01.

