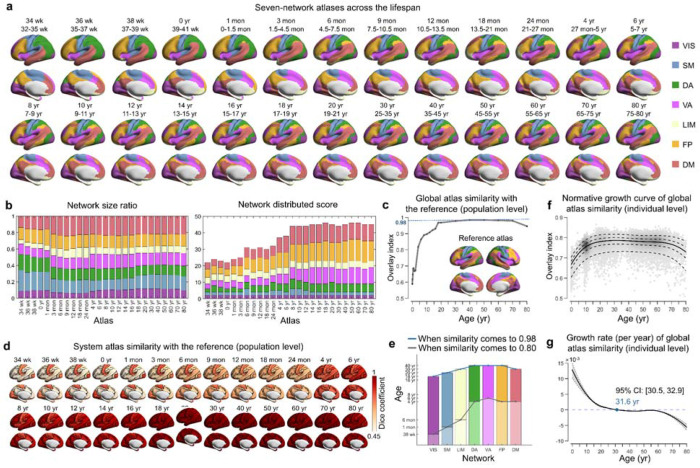
Fig. 2 |. Population-level and individual-level functional atlases throughout the lifespan.
a, Employing the Gaussian-weighted iterative group atlas generation approach (for details, see Methods and Supplementary Fig. 6a), the lifespan set of seven-network functional atlases from 32 postmenstrual weeks to 80 years was established (26 atlases in total). Only the left hemisphere is displayed here; for the whole-cortical atlases, refer to Supplementary Figs 7 and 8. Labels of each system were mapped onto the HCP fs_LR_32k surface and visualized using BrainNet Viewer 59. b, Network size ratio and network distribution score of each system in all age-specific group atlases. The network size ratio was calculated as the vertex number of the system divided by the total cortical vertex number. The network distribution score was measured by the number of spatially discontinuous subregions (≥ 5 vertices) in the system. c, Global similarity of each age-specific group atlas with the reference atlas across the lifespan. The degree of global similarity was defined as the number of vertices with the same label in the two atlases divided by the total number of vertices in both atlases. d, System similarity of each age-specific group atlas with the corresponding system in the reference atlas across the lifespan. System similarity was quantified using the Dice coefficient. e, The ages at which the system similarity of each age-specific group atlas reached 0.8 and 0.98. f-g, Normative growth curve and growth rate of global atlas similarity with the reference atlas when using personalized functional atlas for each participant. The gray shaded areas represent the 95% confidence interval, which was estimated by bootstrapping 1,000 times. VIS, visual; SM, somatomotor; DA, dorsal attention; VA, ventral attention; LIM, limbic; FP, frontoparietal; DM, default mode. wk, week; mon, month; yr, year.

