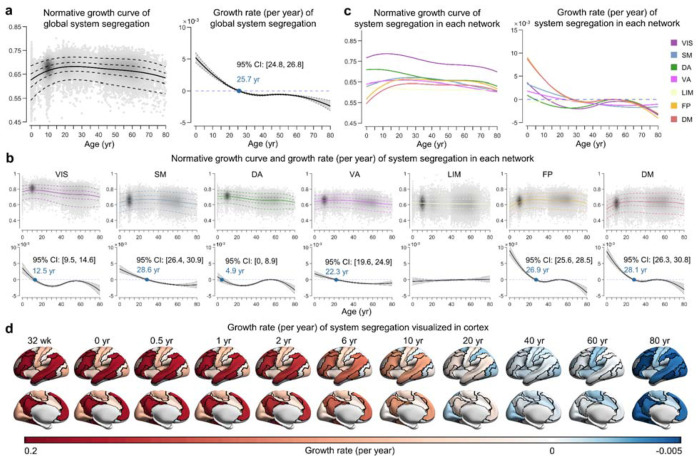
Fig. 3 |. Lifespan normative growth patterns of brain system segregation.
a, Normative growth curve and growth rate of global system segregation. The peak occurred in the third decade of life (25.7 years, 95% bootstrap confidence interval 24.8-26.8). The gray shaded areas represent the 95% confidence interval, which was estimated by bootstrapping 1,000 times. b-c, Normative growth curves and growth rate of system segregation for each network. The median (50th) centile is represented by a solid line, while the 5th, 25th, 75th, and 95th centiles are indicated by dotted lines. The key inflection points are marked in blue font. d, Growth rate of system-specific segregation visualized in the cortex, with black lines depicting system boundaries. The values of each system are mapped and visualized on the HCP fs_LR_32k surface. VIS, visual; SM, somatomotor; DA, dorsal attention; VA, ventral attention; LIM, limbic; FP, frontoparietal; DM, default mode. wk, week; yr, year.

