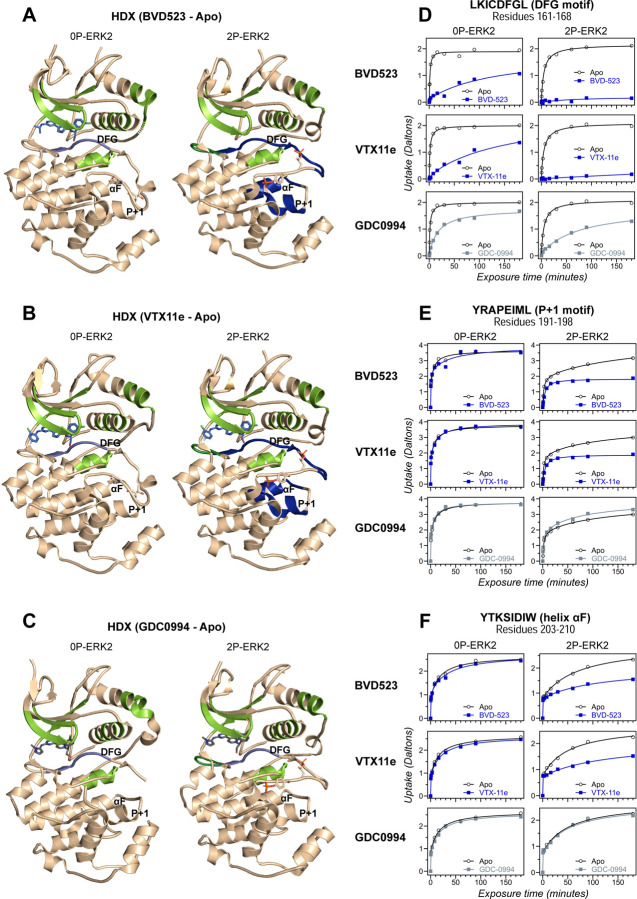
Figure 2. Binding of R-state inhibitors reveals allosteric coupling between the active site and the activation loop.
(A-C) Summary of HDX experiments indicating regions that change in deuterium uptake upon binding of (A) BVD523, (B) VTX11e, and (C) GDC0994. (D-F) HDX time courses showing effects of inhibitors on deuterium uptake at the (D) DFG motif (peptide 161–168: LKICDFGL), (E) P+1 segment (peptide 191–198, YRAPEIML), and (F) helix αF (peptide 203–210: YTKSIDIW). Colored segments in panels A-C indicate regions where HDX decreases or increases upon binding each inhibitor at saturating concentration (20 μM). Full peptide coverage and locations of segments that undergo changes in HDX with inhibitor binding are shown in Suppl. Figs. S2 and S3. Highlighted in light green in panels A-C are regions where a similar degree of HDX protection is seen with all inhibitors in both 0P-ERK2 and 2P-ERK2 (Gly loop, hinge, helices αC, αE and αL16). HDX protection is similar with all inhibitors in strands β7-β8 (dark green) in 2P-ERK2, but not 0P-ERK2. Time courses for these peptides are shown in Suppl. Fig. S4. Highlighted in light blue are regions where BVD523, VTX11e or GDC0994 lead to decreased HDX uptake around the DFG motif, in 0P-ERK2 or 2P-ERK2. Highlighted in dark blue are regions where BVD523 and VTX11e lead to increased HDX protection, compared to GDC0994. These occur only in 2P-ERK2, and include the DFG motif and adjacent strand β9, as well as the P+1 segment and helix αF. Time courses for strand β9 are shown in Suppl. Fig. S5. Full HDX datasets for all inhibitors are presented in Suppl. Dataset S1. Crystal structures shown in panels A-C are (A) PDBID: 6GDQ (left) and 2ERK (right); (B) PDBID: 4QTE (left) and 6OPK (right); (C) PDBID: 5K4I (left) and 6OPH (right).

