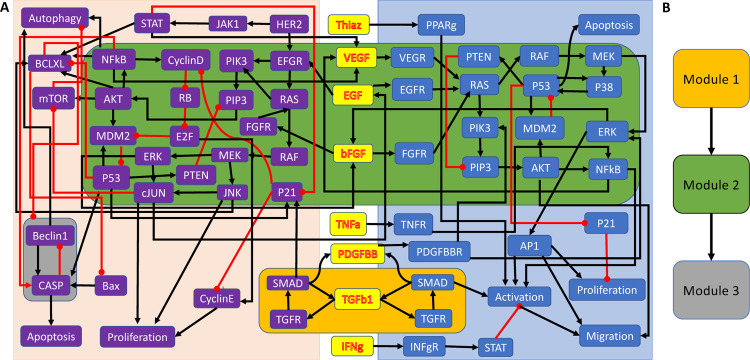
Figure 5:
A multicellular Boolean cancer model (30), which describes the interactions of pancreatic cancer cells (purple nodes), pancreatic stellate cells (blue nodes), and their connecting cytokines (yellow nodes). (a) Wiring diagram describing the regulations between nodes, which are all monotonic, with black and red arrows indicating activation and inhibition, respectively. The non-trivial modules are highlighted by amber, green, and gray boxes. (b) Directed acyclic graph describing the connections between the non-trivial modules.

