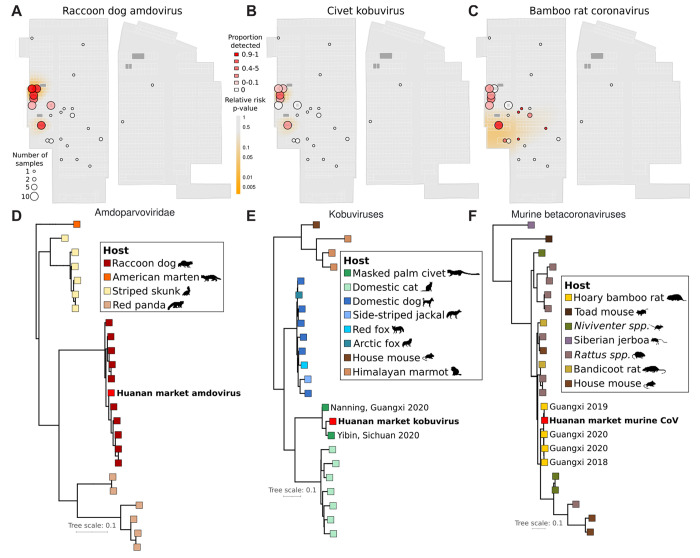
Figure 4: Animal viruses in the Huanan market.
(A–C) The spatial distribution of detection of three wildlife viruses detected in the Huanan market in sequenced samples collected in the market on January 1st and 12th. Bubbles correspond to stalls, and the bubble color represents the mean proportion of reads mapping to the viral genome from samples in that stall. The heatmap shown is a quantification of the p-value distribution for a relative risk analysis, showing spatial distribution of enriched positivity for each virus. (D–F) Maximum likelihood phylogenies of the market consensus sequence for each of the three viruses shown in (A–C). Each reference virus is colored by the species it was reported as isolated from.

