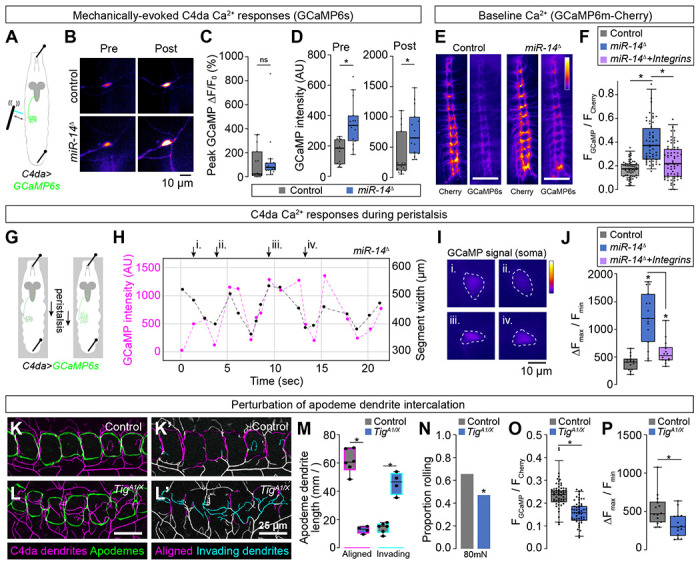
Fig 8. Epidermal dendrite intercalation tunes C4da neuron calcium levels and nociceptive sensitivity.

(A-F) Epidermal dendrite intercalation regulates baseline calcium levels in C4da neurons. (A) Larval preparation for imaging mechanically-evoked calcium responses in C4da neurons. (B) Control and miR-14 mutant larvae exhibit comparable amplitudes of GCaMP6s responses (ΔF/F0) in C4da neurons to mechanical stimulus (n = 15 larvae each, p = 0.217, Wilcoxan rank sum test). (C) GCaMP6s fluorescence intensity is significantly elevated in miR-14 mutant C4da axons prior to mechanical stimulus and 5 min after mechanical stimulus (n = 15 larvae each, p = 0.0003 pre-stimulus, p = 0.002 post-stimulus, Wilcoxon rank sum test). (E-F) Ratiometric calcium imaging using a GCaMP6s-Cherry fusion protein expressed selectively in C4da neurons (ppk-GAL4, UAS-Gerry). (E) Representative images depict fluorescence intensity of Cherry and GCaMP6s for wild-type control and miR-14 mutant larvae. (F) miR-14 mutants exhibit elevated GCaMP/mCherry fluorescence ratios in C4da axons. Points represent measurements from individual abdominal segments (A2-A8) from 10 larvae of each genotype (n = 64 data points in control larvae, 56 in miR-14 mutants, 66 in miR-14 + ppk>Integrin larvae). *P<0.05, Kruskal-Wallis test followed by Dunn’s post-hoc test. (G-J) miR-14 mutant C4da neurons exhibit enhanced calcium responses during peristalsis. (G) Schematic of imaging preparation. Larvae are pinned to limit locomotion while allowing propogation of peristaltic waves. (H) Plot depicts GCaMP signal intensity and segment width for a representative miR-14 mutant C4da neuron during fictive peristalsis. (I) Widefield fluorescence images show GCaMP signal at the timepoints indicated in (H). (J) Plot depicts peristalsis-induced C4da calcium responses in larvae of the indicated genotypes. Points correspond to individual neurons and values represent the maximum change in GCaMP fluorescence normalized to minimum GCaMP fluorescence during a 20 sec imaging trial. *P<0.05, Kruskal-Wallis test followed by Dunn’s post-hoc test. (K-M) Mutation of the PS2 integrin ligand Tig prevents dendrite intercalation between apodemes. Representative maximum intensity projections of larvae expressing ppk-CD4-tdTomato to label C4da dendrites and NrgGFP to label epidermal junctions are shown for (K) TigA1/+ heterozygote control and (L) TigA1/X mutant larvae. C4da dendrites are depicted in magenta and apodemes in green using an apodeme mask to subtract NrgGFP signal in other cells. (K’ and L’) C4da dendrites are pseudocolored according to their orientation at apodemes (magenta, aligned along apodeme junctional domains; cyan, invading apodeme territory). (M) TigA1/X mutant larvae exhibit a significant reduction in junctional dendrite alignment at apodemes and an increase in dendrite invasion into apodeme territory. *P<0.05, ANOVA with a post-hoc Sidak’s test. (N-P) Dendrite intercalation at apodemes tunes nociceptive sensitivity. (N) TigA1/X mutant larvae exhibit a significant reduction in rolling responses to noxious mechanical stimulus. (O-P) TigA1/X mutant larvae exhibit a significant reduction in (O) GCaMP/mCherry fluorescence ratios in C4da axons and (P) peristalsis-induced calcium responses in C4da neurons. Points represent measurements from individual neurons. *P<0.05, Wilcoxon rank sum test in (N-P).
Experimental genotypes:
(A-D) Control: w1118;; ppk-LexA, AOP-GCaMP6s
miR-14Δ1: w1118; miR-14Δ1; ppk-LexA, AOP-GCaMP6s
(D-J) Control: w1118;; ppk-GAL4, UAS-Gerry / +
miR-14Δ1: w1118; miR-14Δ1; ppk-GAL4, UAS-Gerry / +
miR-14Δ1 + Integrins: w1118; miR-14Δ1; ppk-GAL4, UAS-Gerry / UAS-mew, UAS-mys
(K-M) Control: w1118;; Nrx-IVGFP, ppk-CD4-tdTomato10A
TigA1/X: w1118; TigA1 / TigX; Nrx-IVGFP, ppk-CD4-tdTomato10A
(N) Control: w1118; TigA1 / +
TigA1/X: w1118; TigA1 / TigX
(O-P) Control: w1118; TigA1 / +; ppk-GAL4, UAS-Gerry
TigA1/X: w1118; TigA1 / TigX; ppk-GAL4, UAS-Gerry
