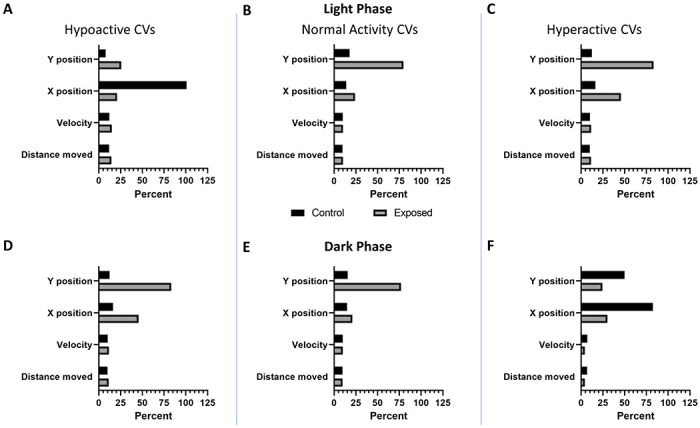
Figure 3: Coefficients of variation per larval activity state.

Coefficients of variation (CVs) for each of the main numerical features (A – C) in the light (D – F) and in the dark. Columns show CVs of larval zebrafish significantly (p < 0.05) (A, D) hypoactive, (B, E) normal activity, or (C, F) hyperactive relative to their respective controls.
