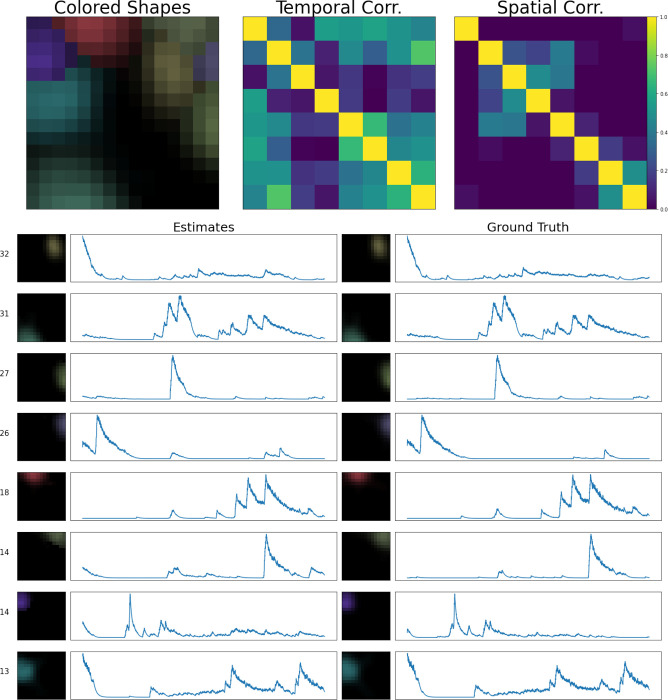
Figure 7: Sample frame of a simulated demixing video.
Here, we show all components extracted from a spatial patch of the simulated dataset described in Fig. 6. In the lower half of this figure, we provide every estimated component’s spatial and temporal footprint in the left column. These estimates are ordered in terms of their maximum brightness (maximum of ) in the video. Next to each component’s spatial footprint, we provide this maximum brightness value for reference. Each estimate is matched with its corresponding ground truth neural signal. In this example all of our estimated components match the ground truth with high accuracy. Each component is assigned a unique color (matching the colors assigned in Fig. 6). In the top left corner, we provide an aggregate image, showing a max-projection of each component (in its corresponding color) as it appears in the field of view. To the right of that panel, we provide temporal and spatial correlation matrices of our estimated components.

