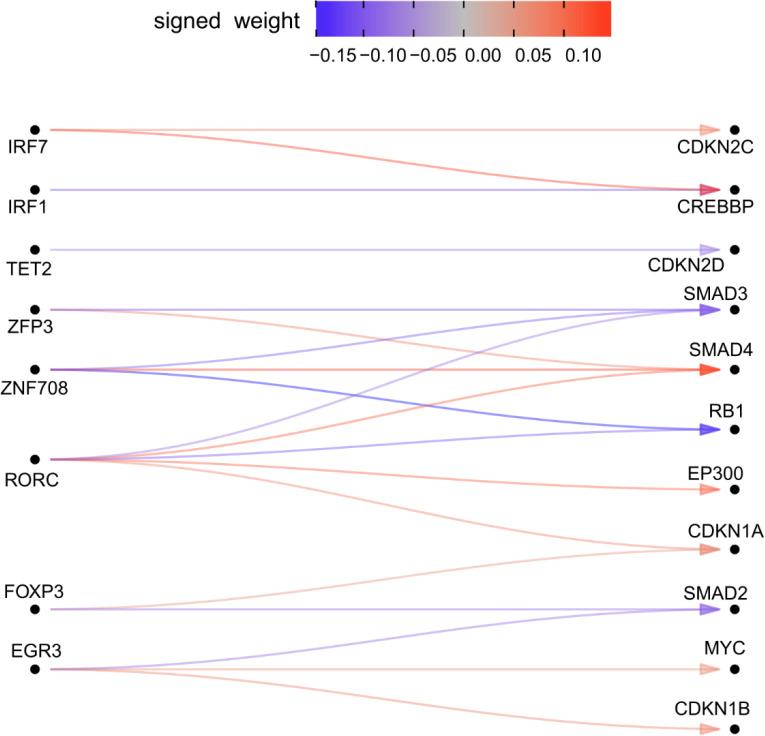
Extended Data Figure 10 |.
Network plot demonstrates the effect of the cluster 2A upstream regulators on cell-cycle genes. The network using edges estimated from the BG model are plotted. Colors indicate the effect size and arrows indicate the direction of effect. The genes on the left-hand side are among the 84 KO’d genes, and the genes on the right are genes that are listed among the KEGG cell cycle pathway genes.

